Soil Moisture Monitoring
This application shows an example of a sensor monitoring system in conjunction with SVADSS data management.
More than 50 soil moisture sensors monitor the groundwater level after a groundwater lowering on a new site.
The background to this monitoring system is the preservation of trees and plants in the surrounding of the new construction site.
Performance Parameter
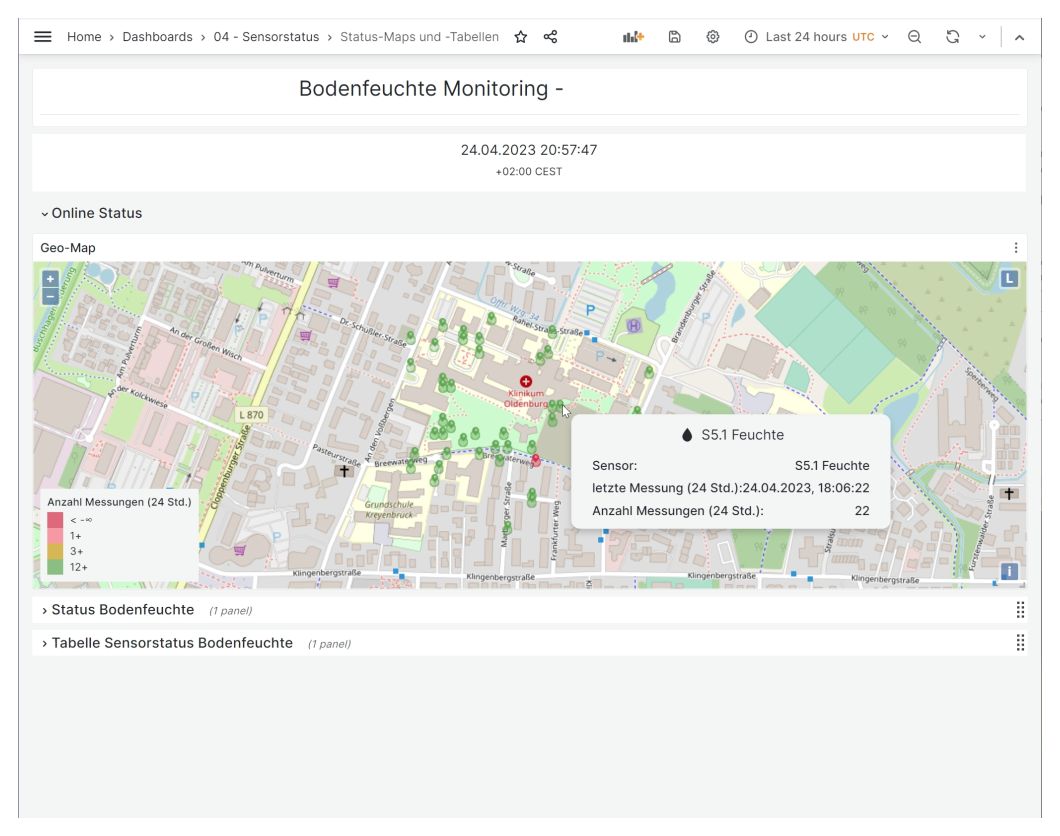
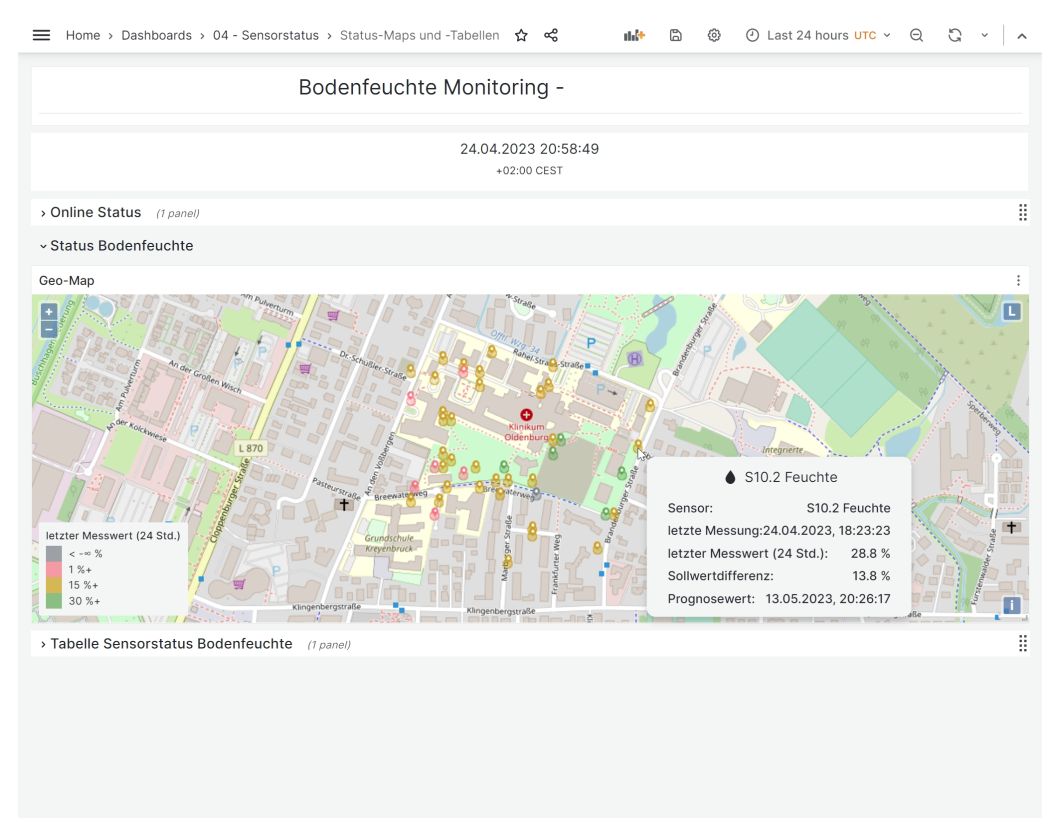
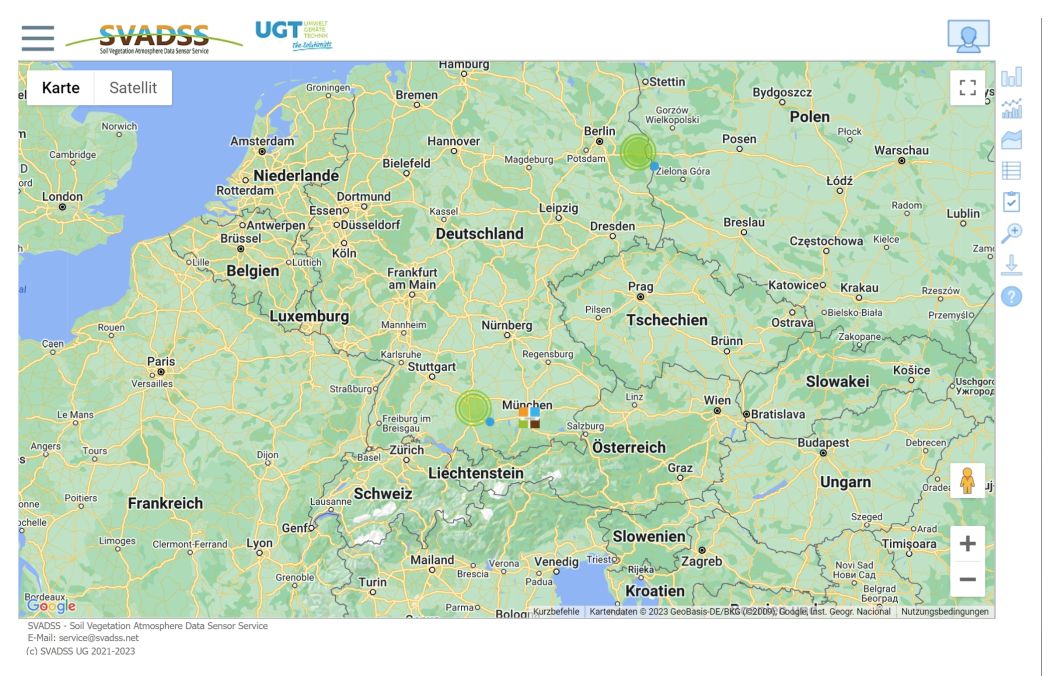
- GPS positions are stored in our database and are displayed in a geomap.
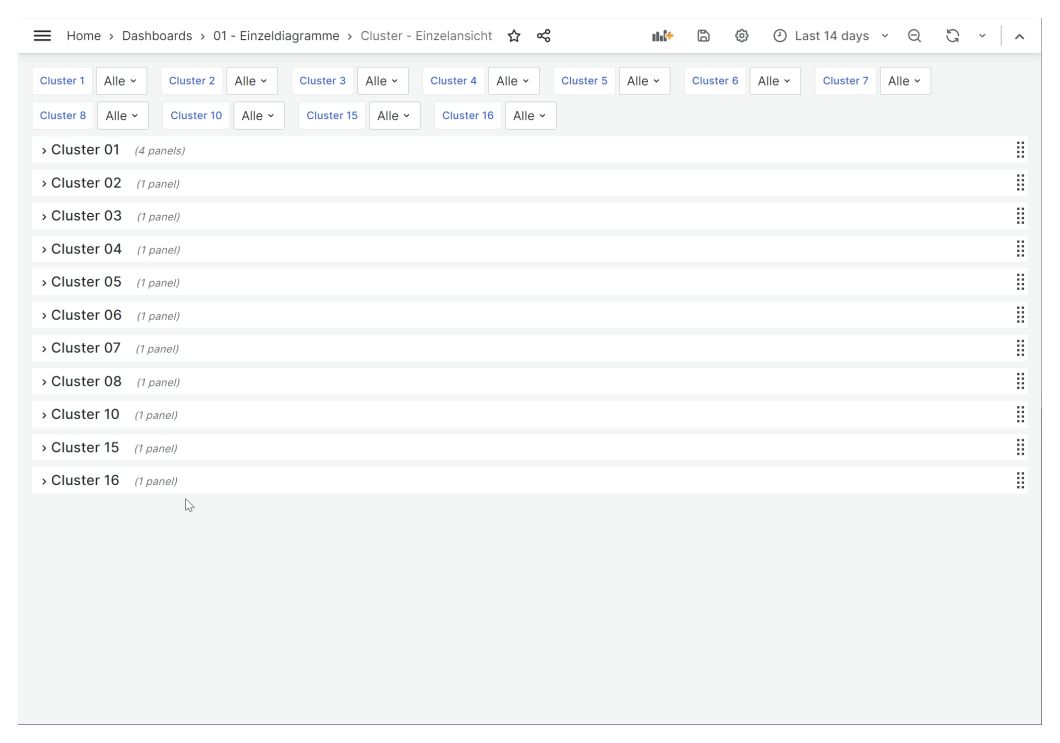
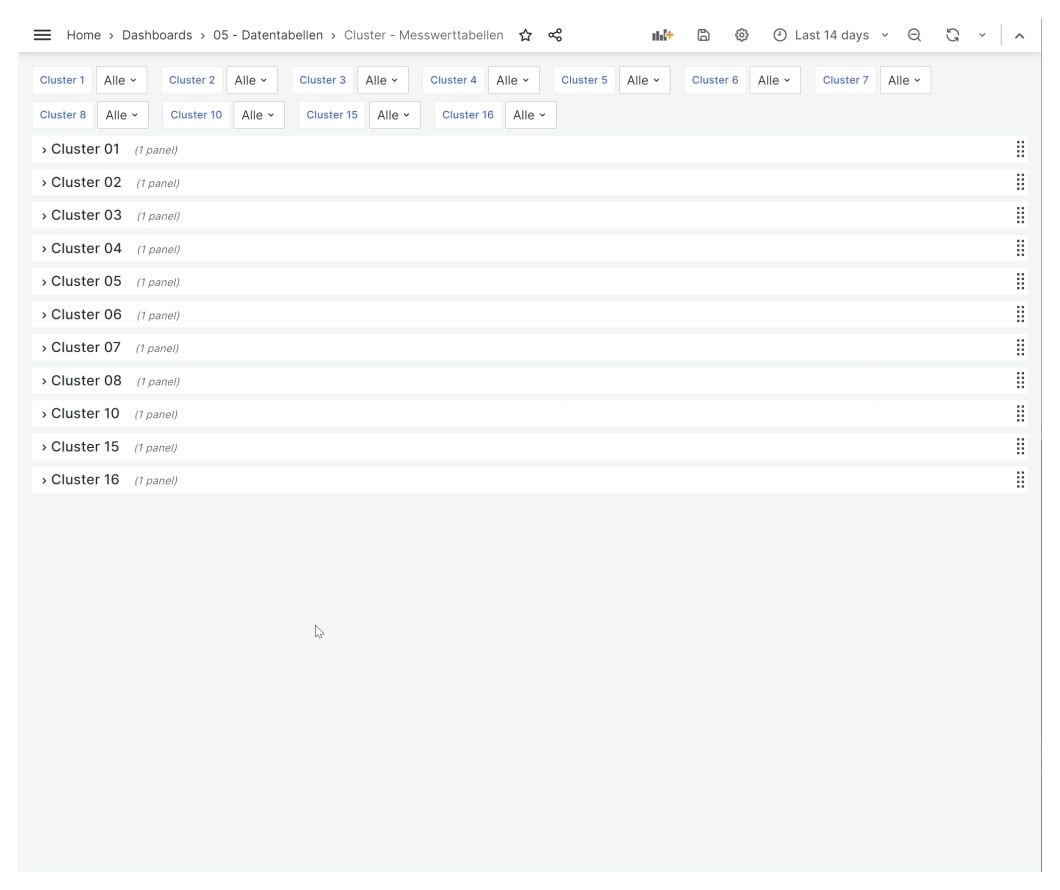
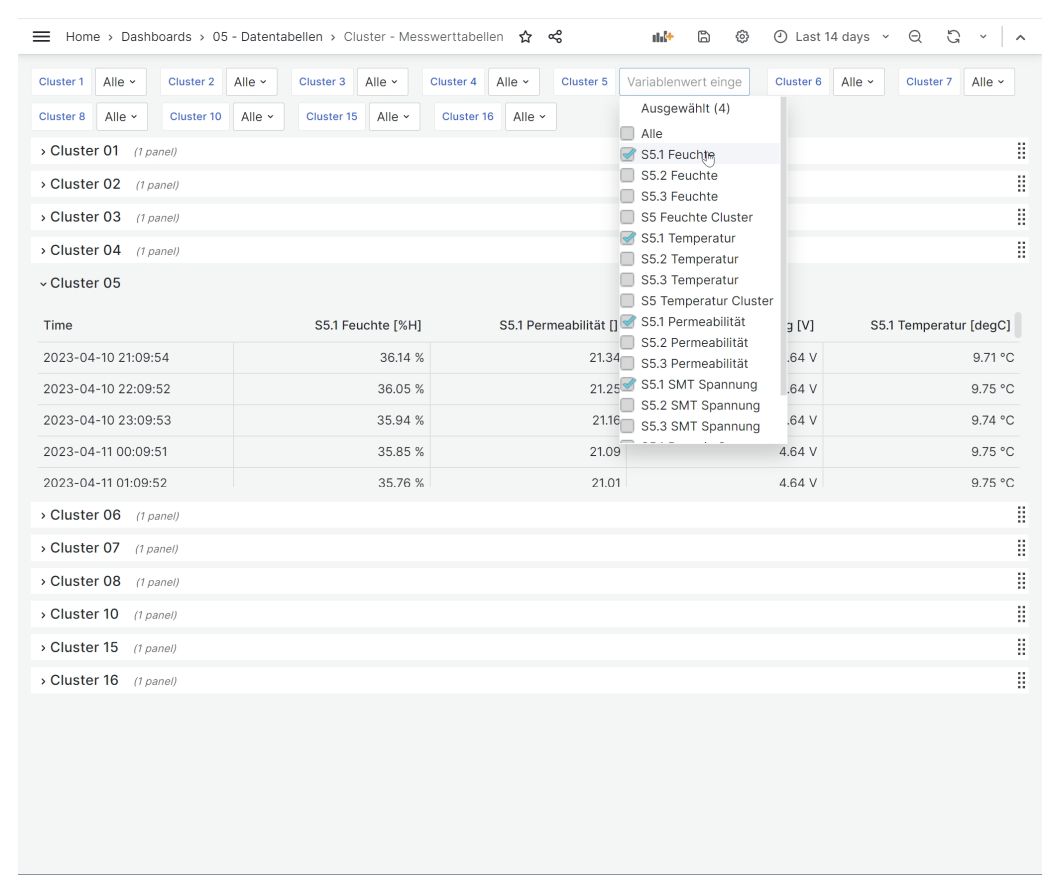
- The sensors are grouped into clusters, cluster values are calculated from the measured values.
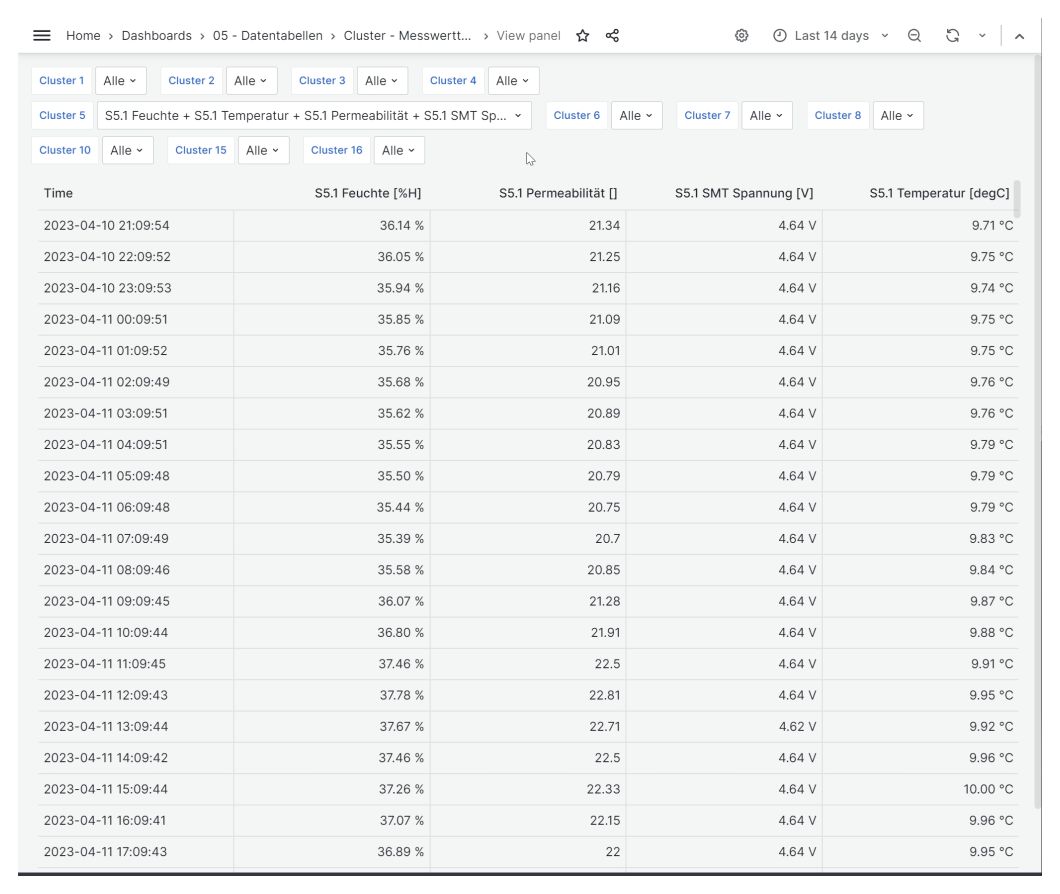
- Soil moisture and temperature are recorded every hour.
- Each measurement cluster can be switched on and off.
- An alarm system sends messages when the soil moisture level falls below the limit value.
- A moving forecast value is calculated from measured and target values so that timely irrigation can be carried out.
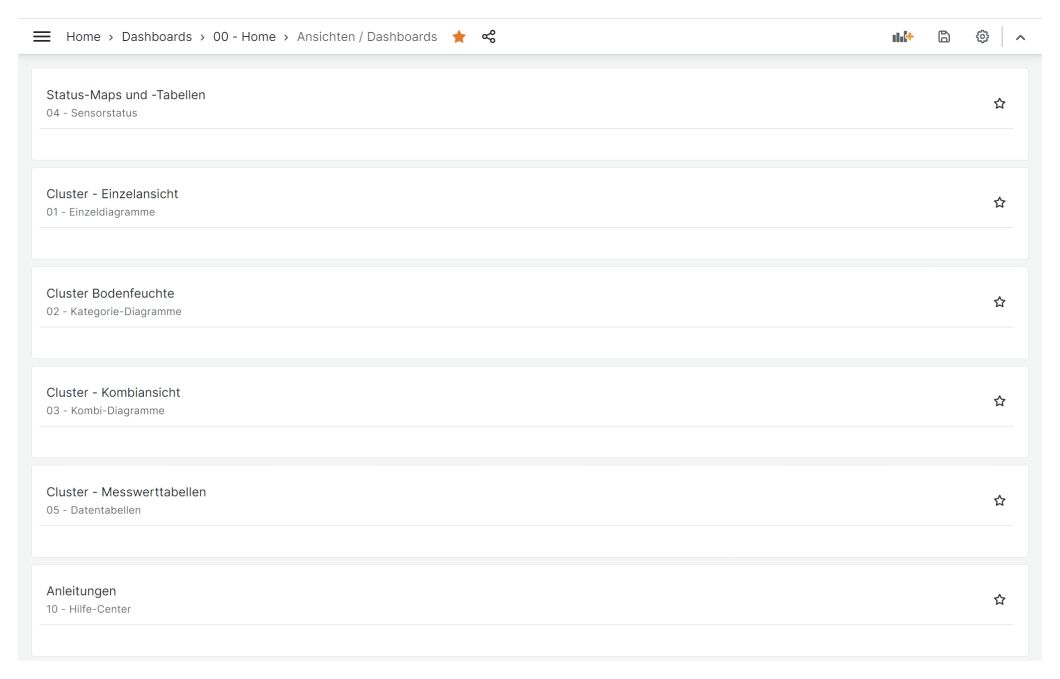
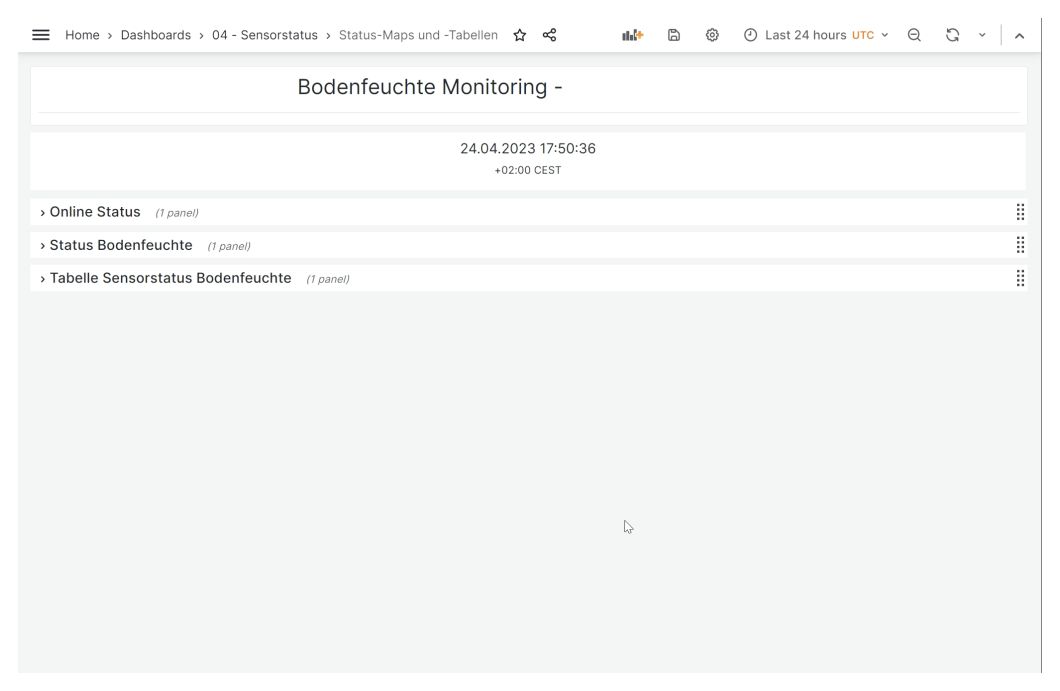
Monitoring Dashboard
- Online state : Overview, qualified by the number of transmitted readings in the last 24 hours
- Soil moisture state : Overview, qualified by defined target values
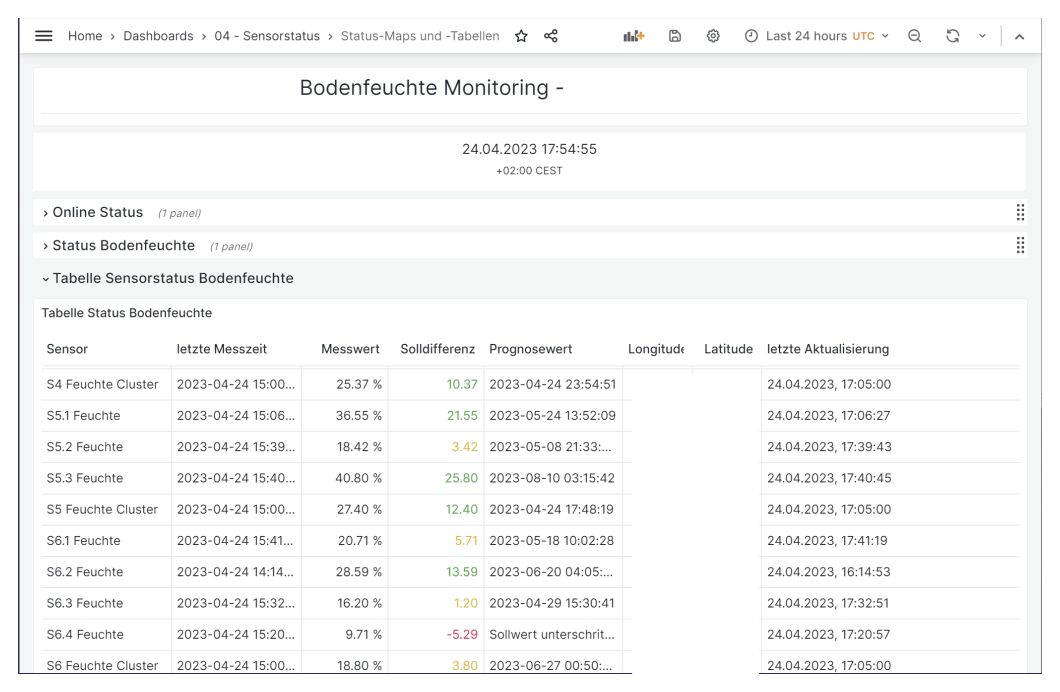
- A data table shows the essential status values per sensor/cluster.
In the case of geo-maps, extended information about the sensors are displayed on mouse-over.
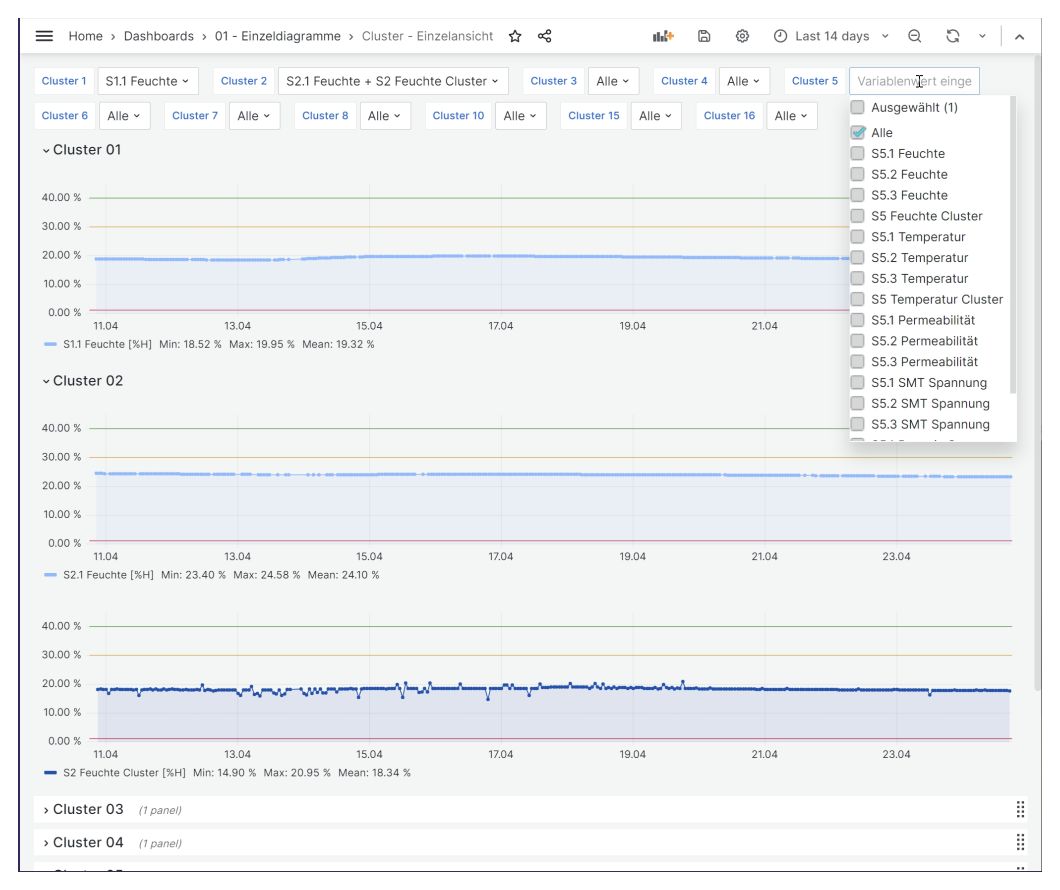
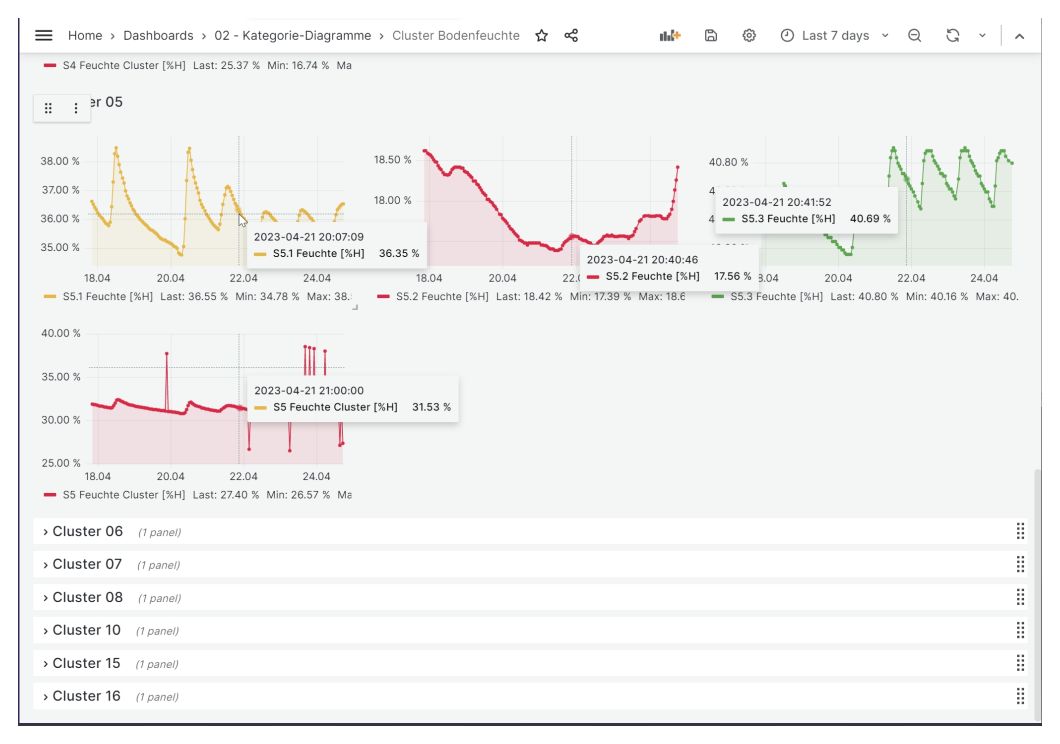
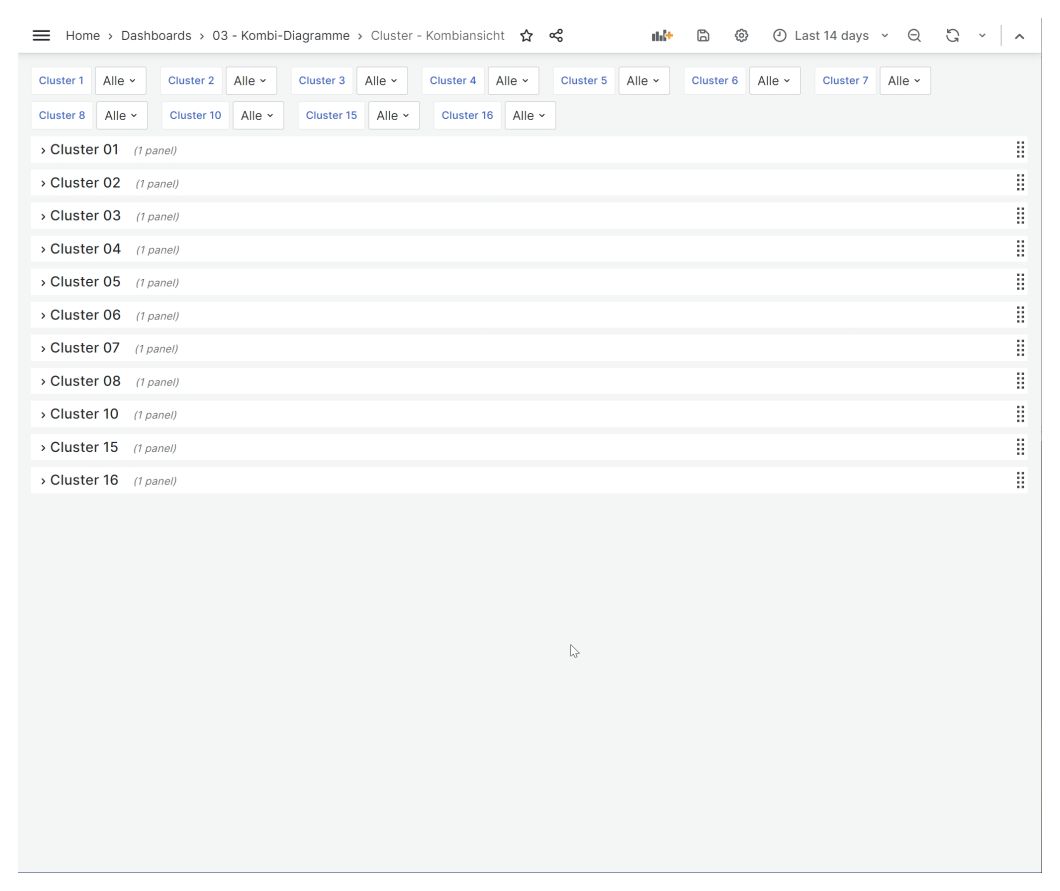
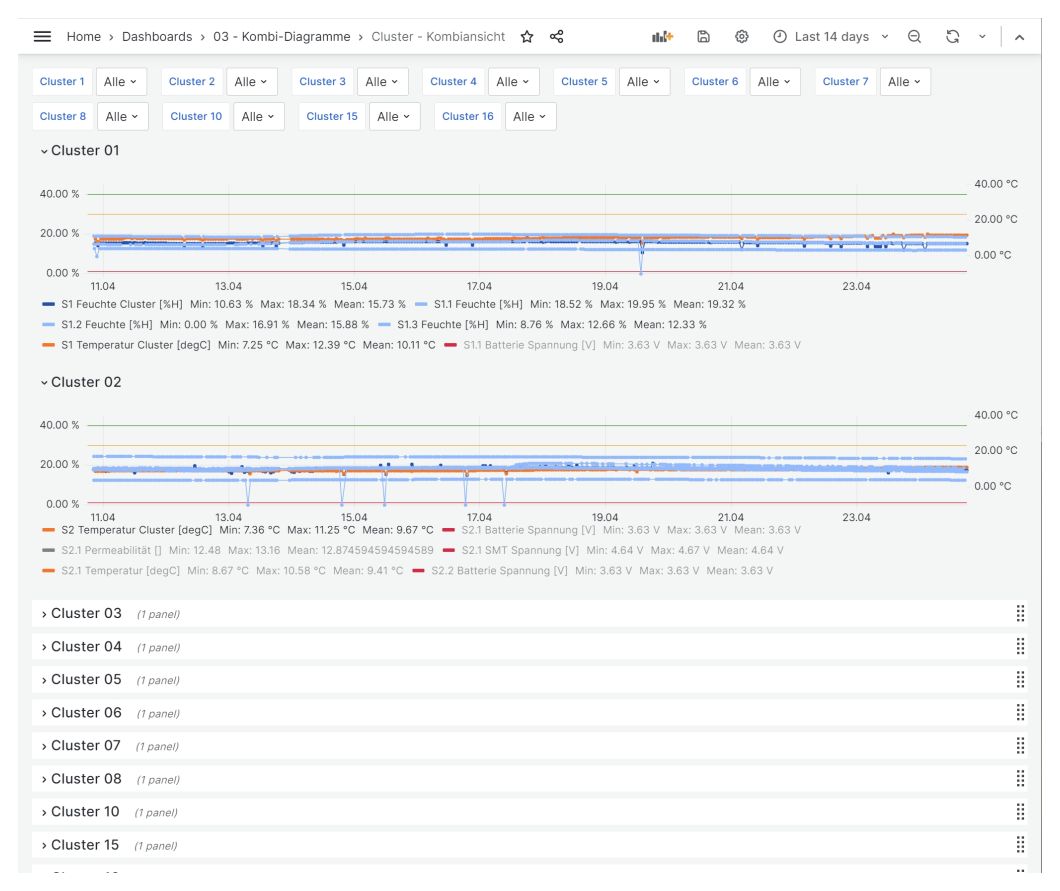
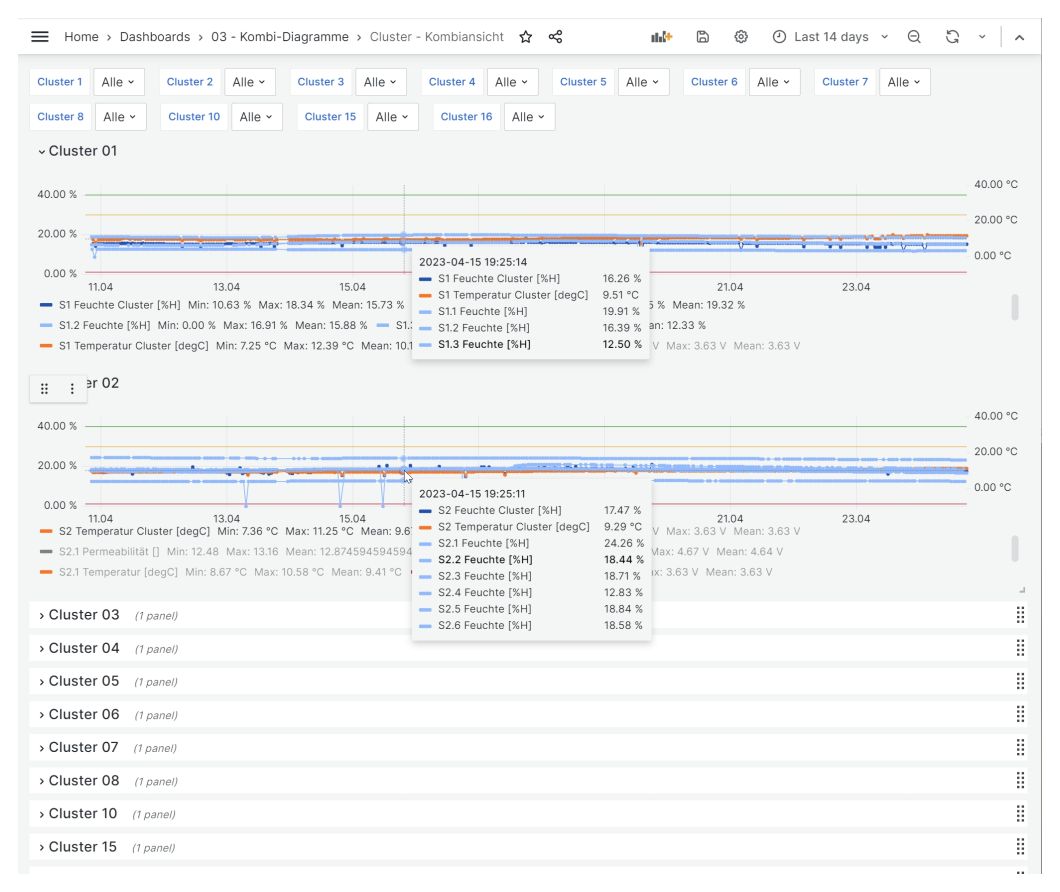
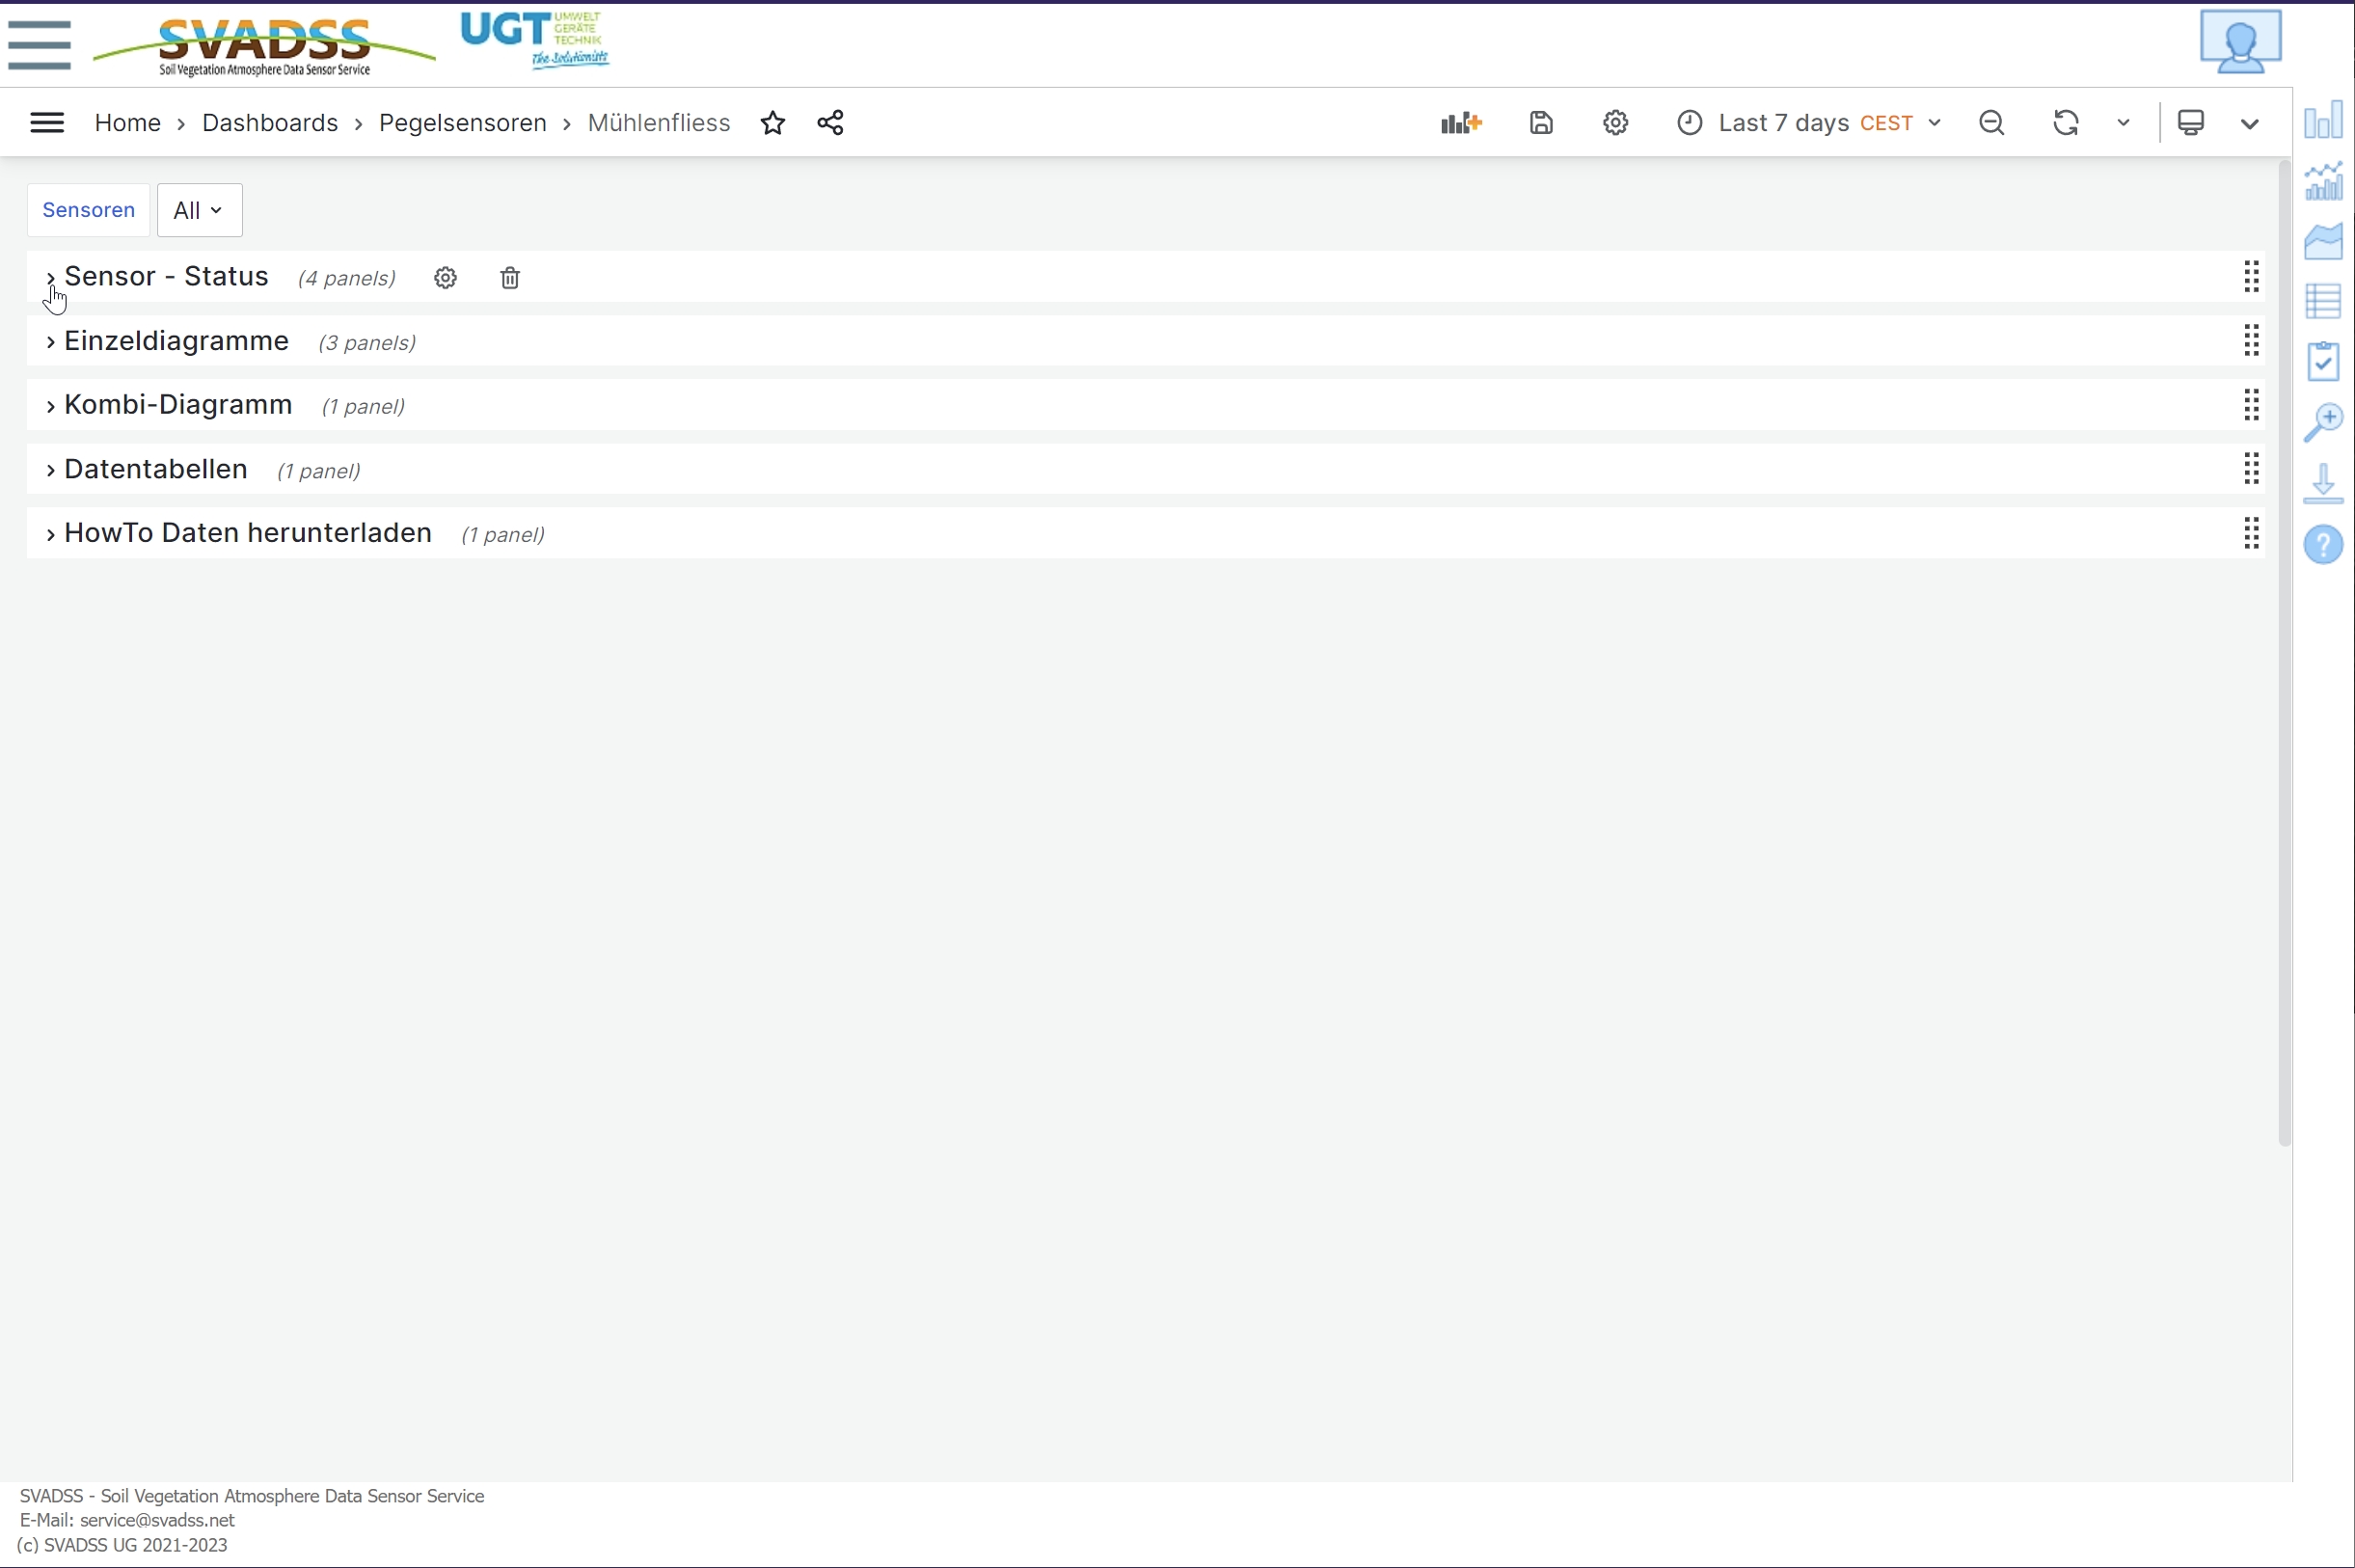
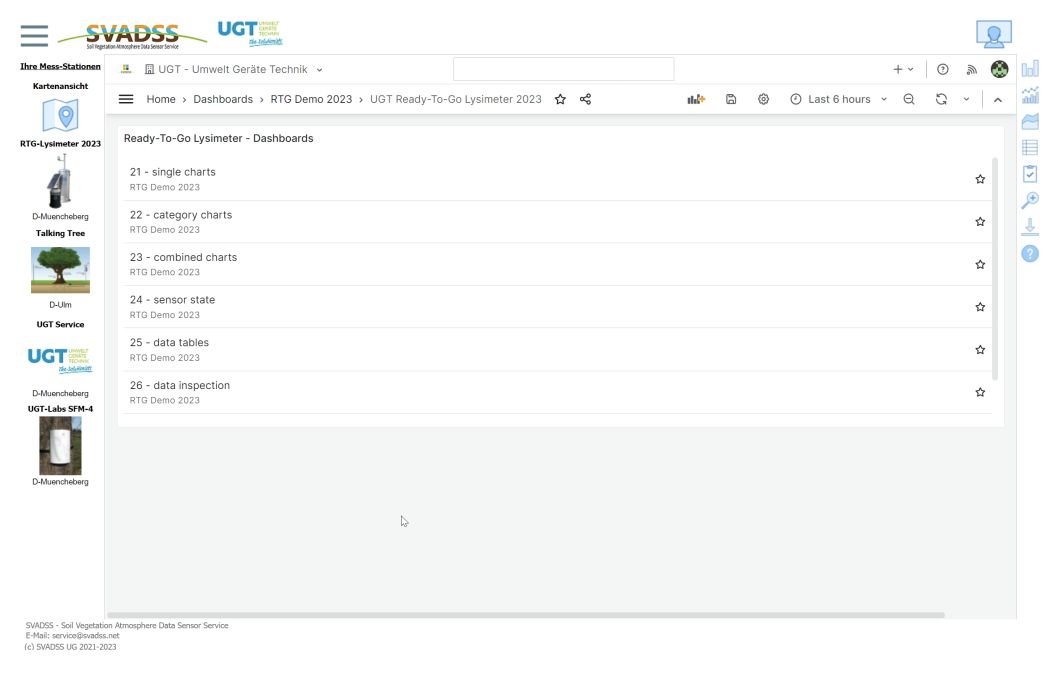
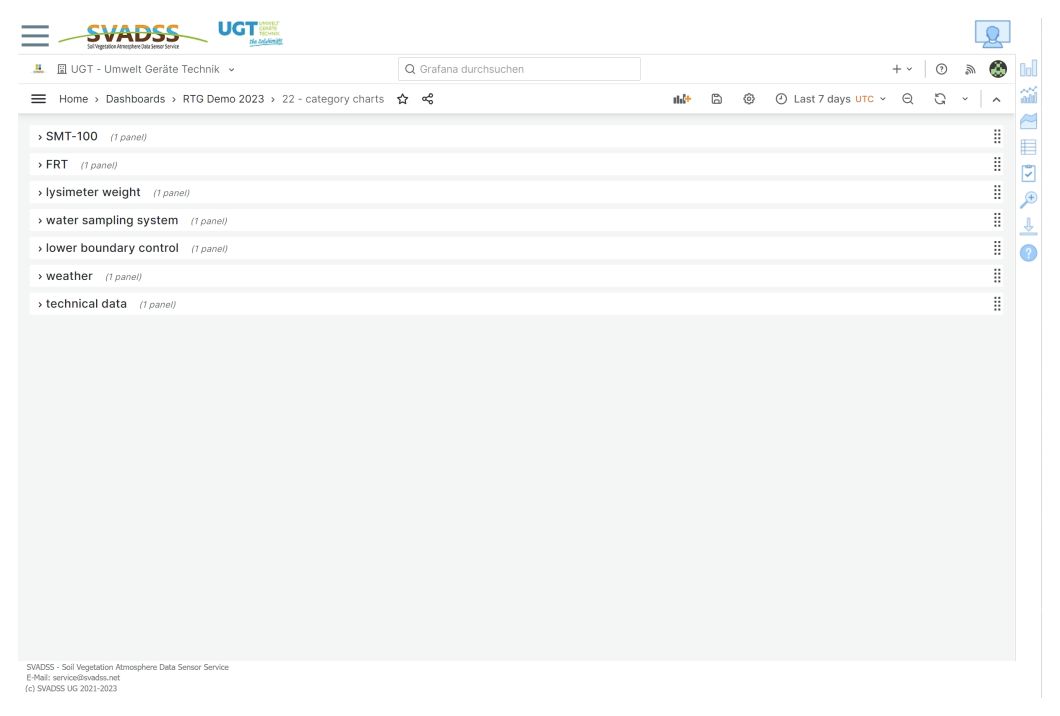
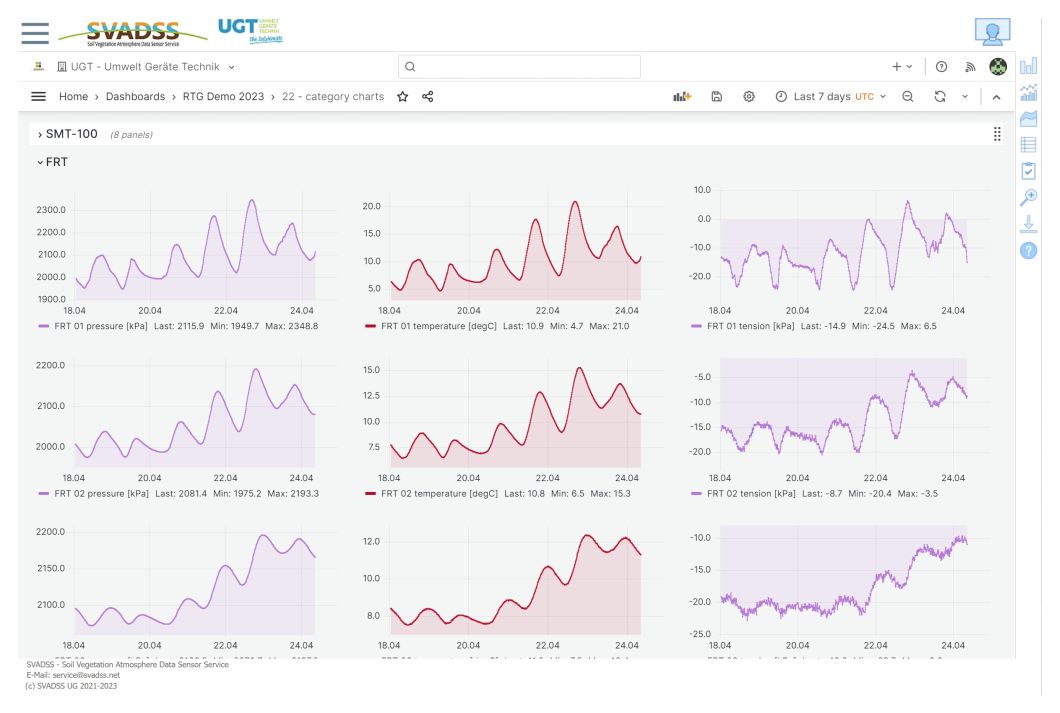
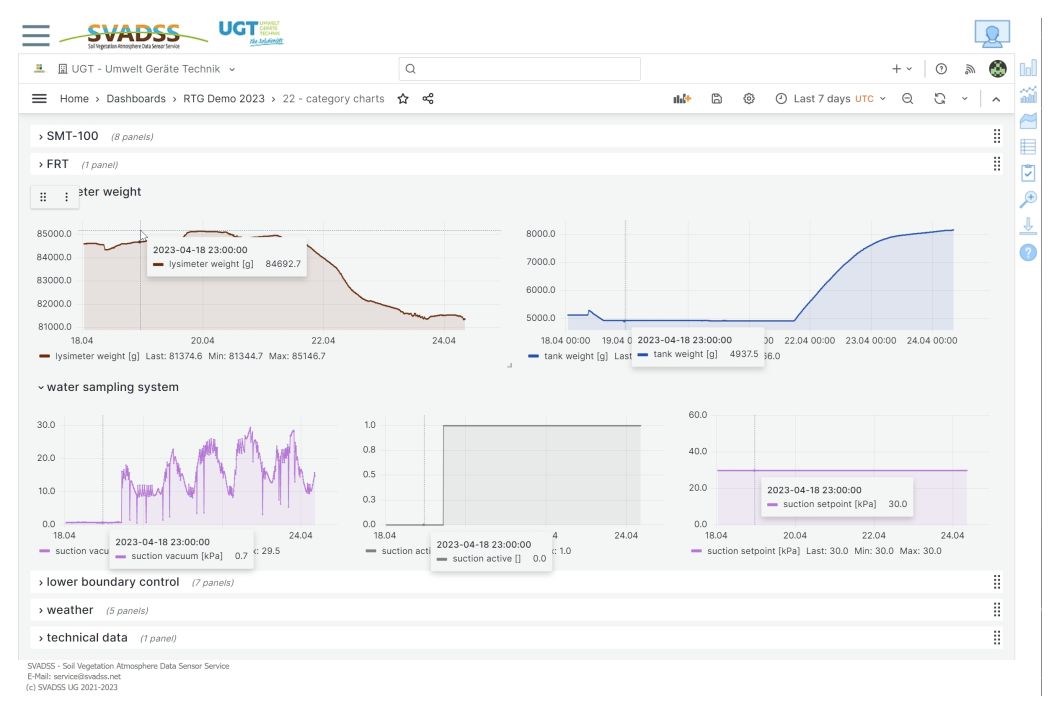
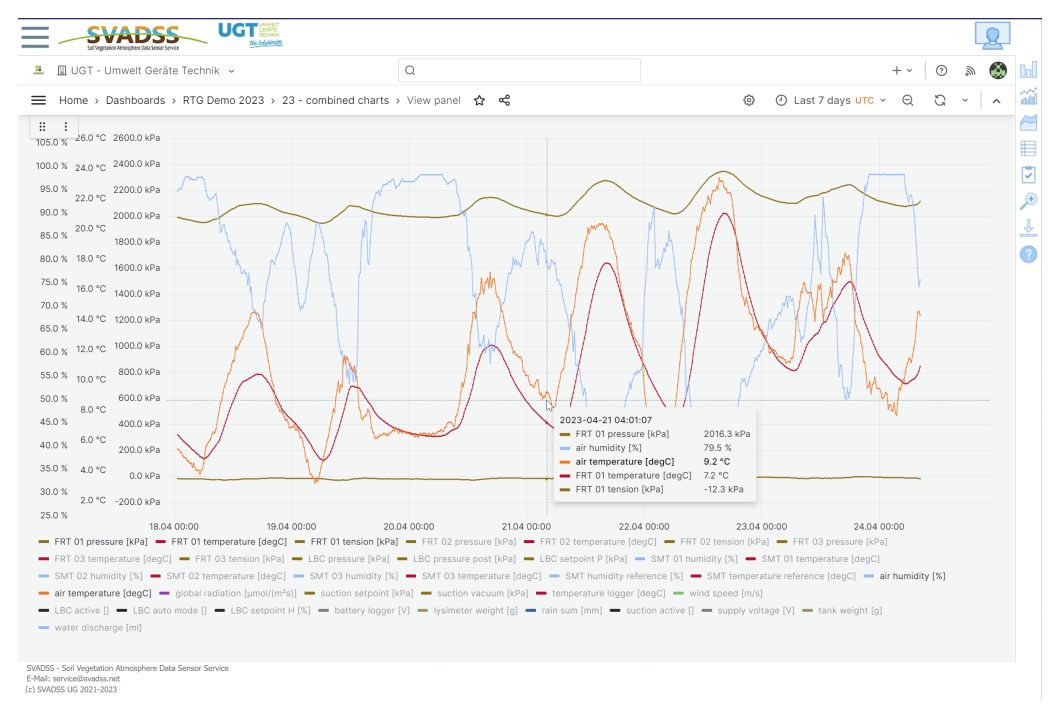
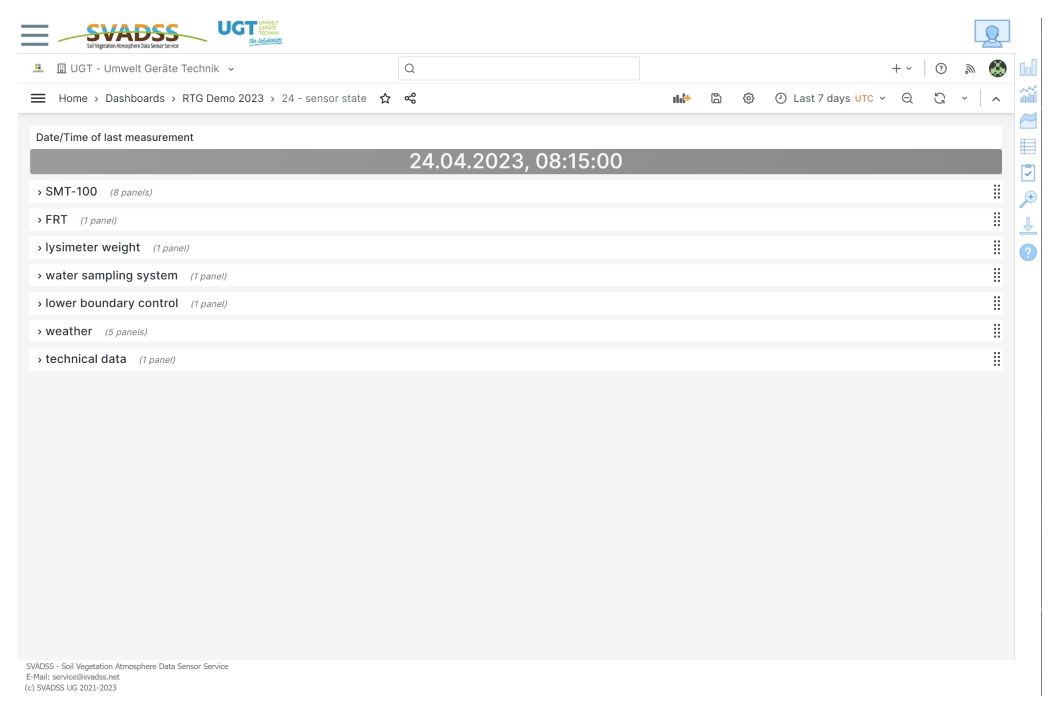
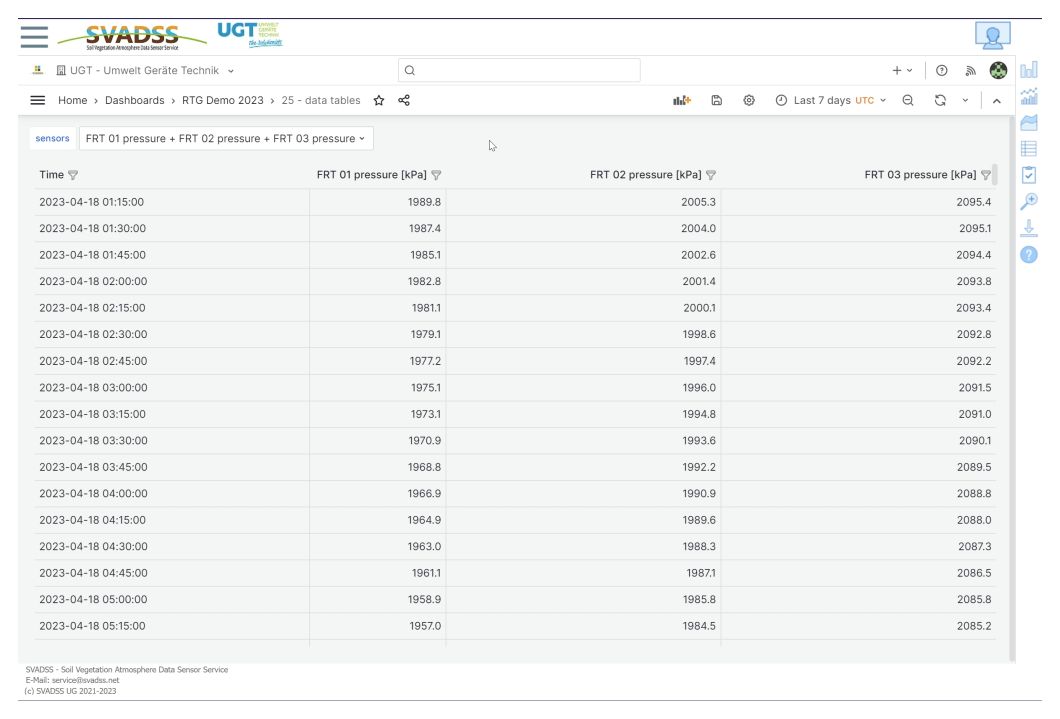
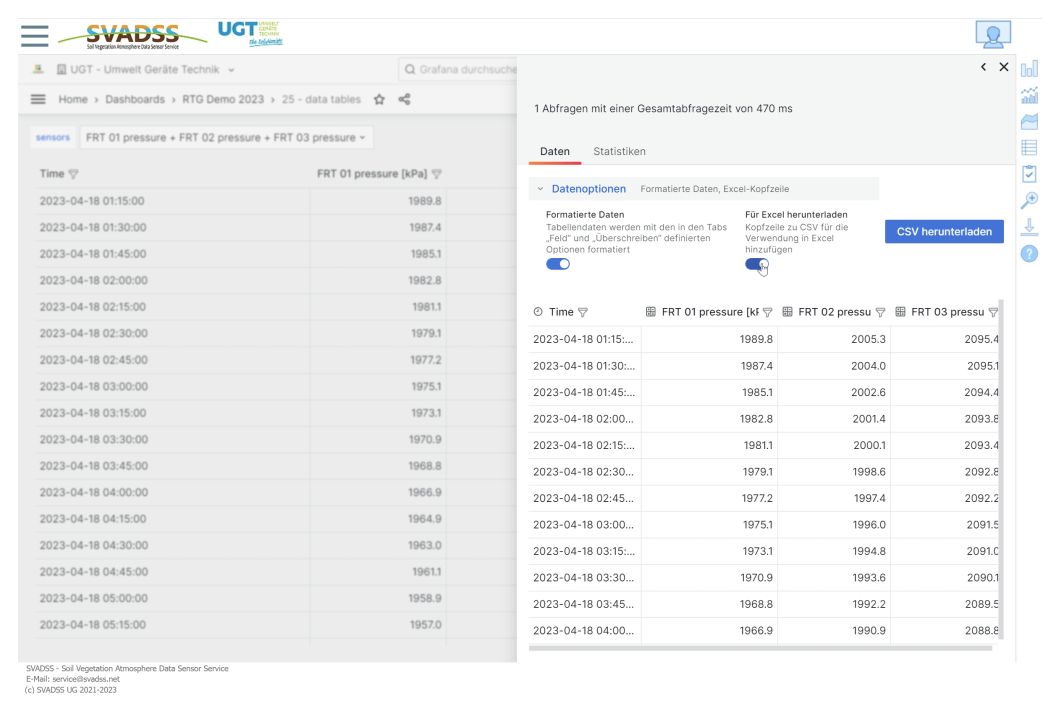
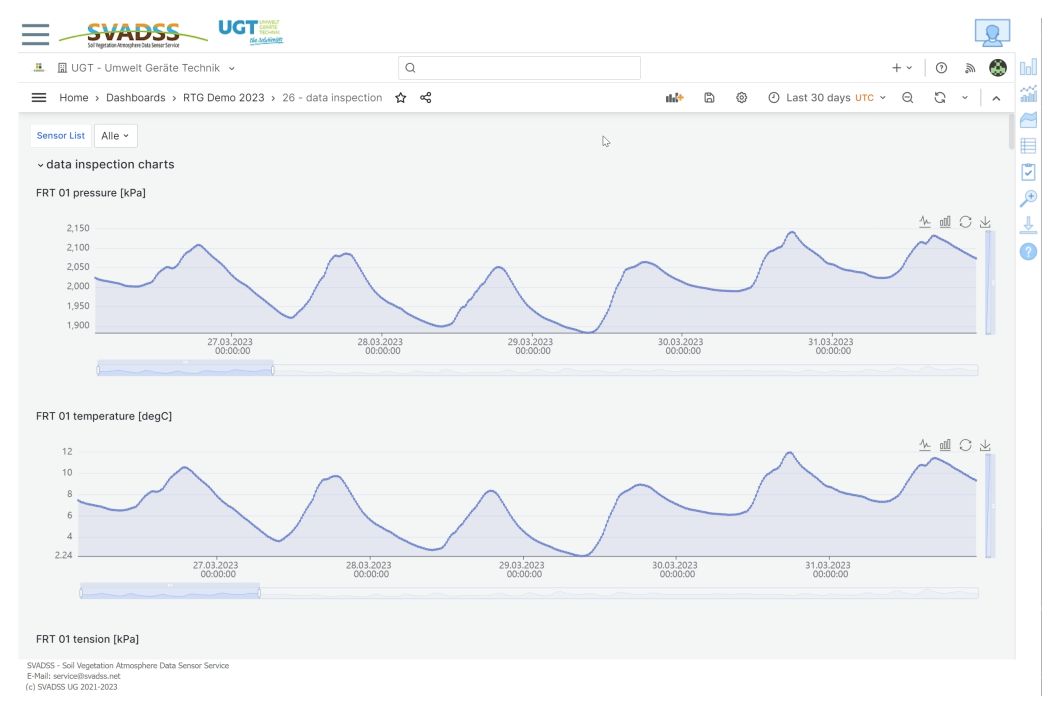
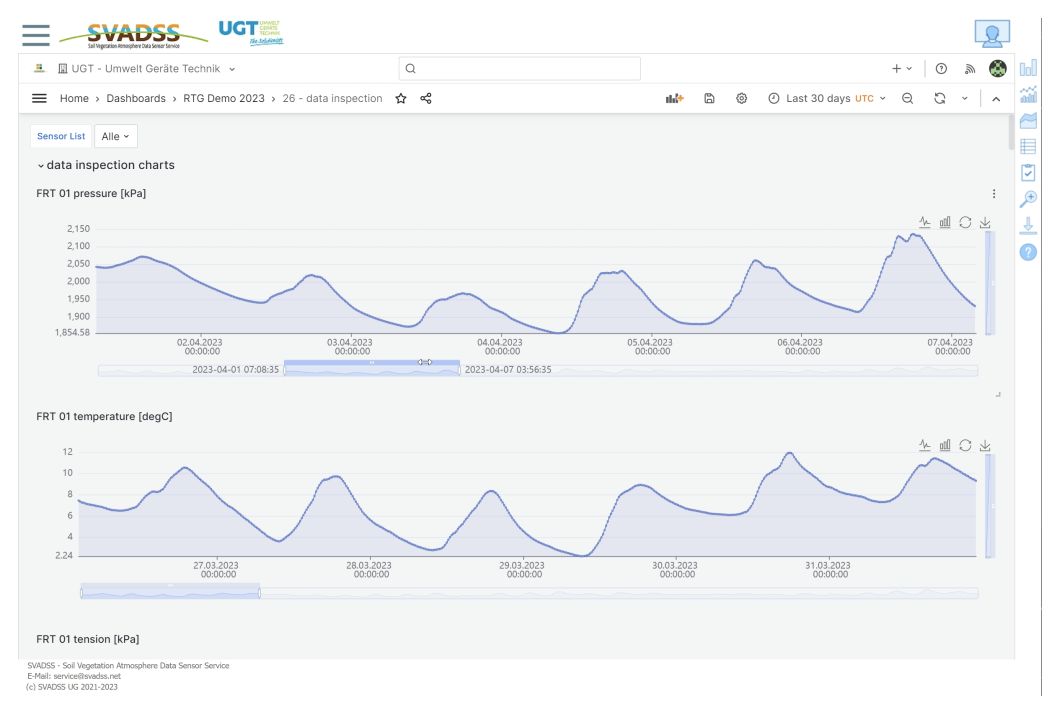
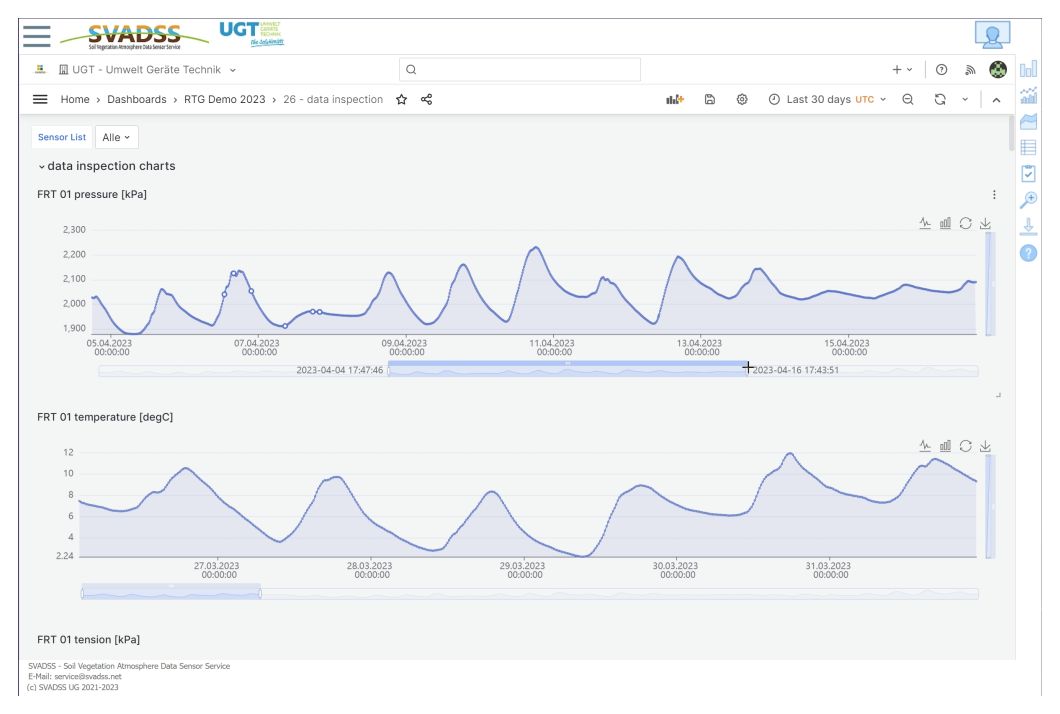
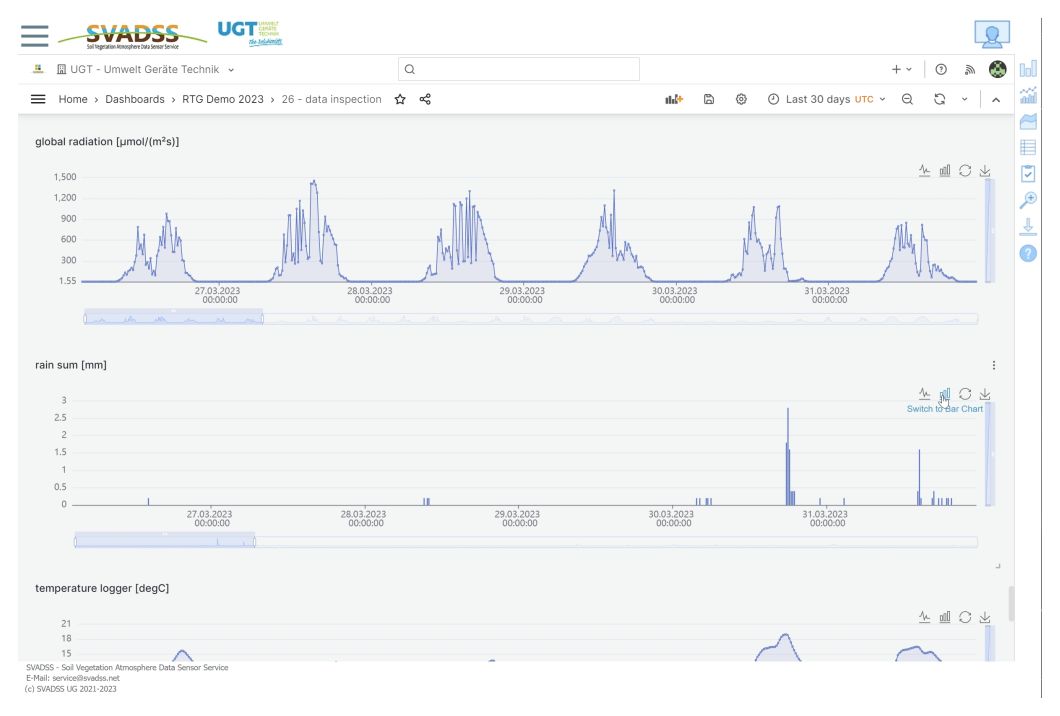
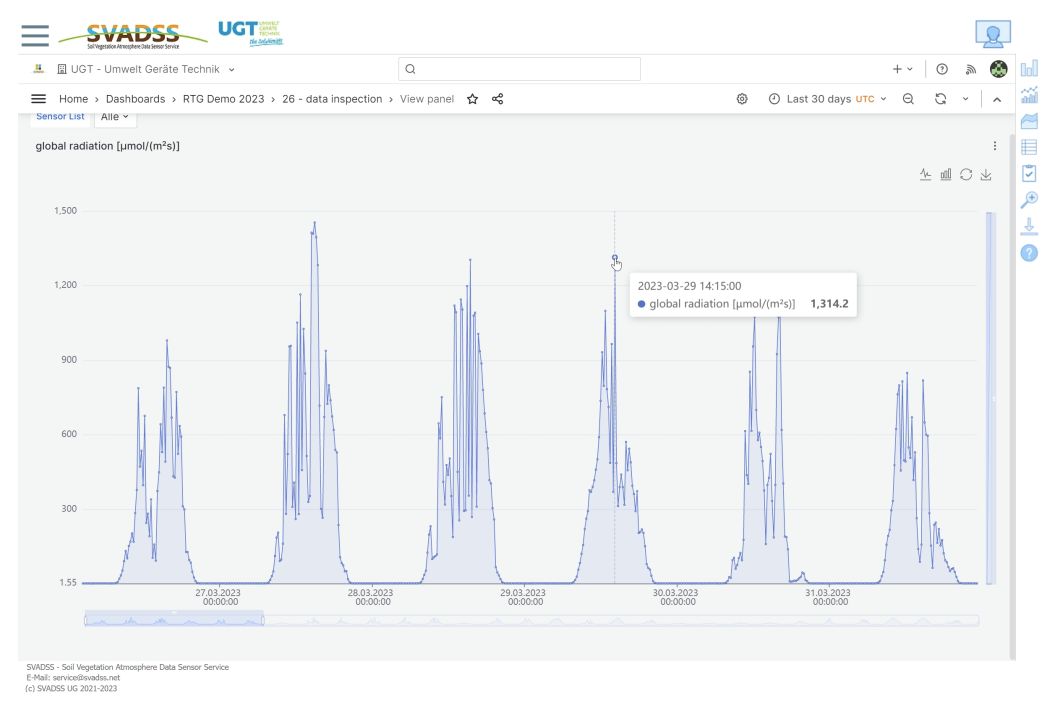
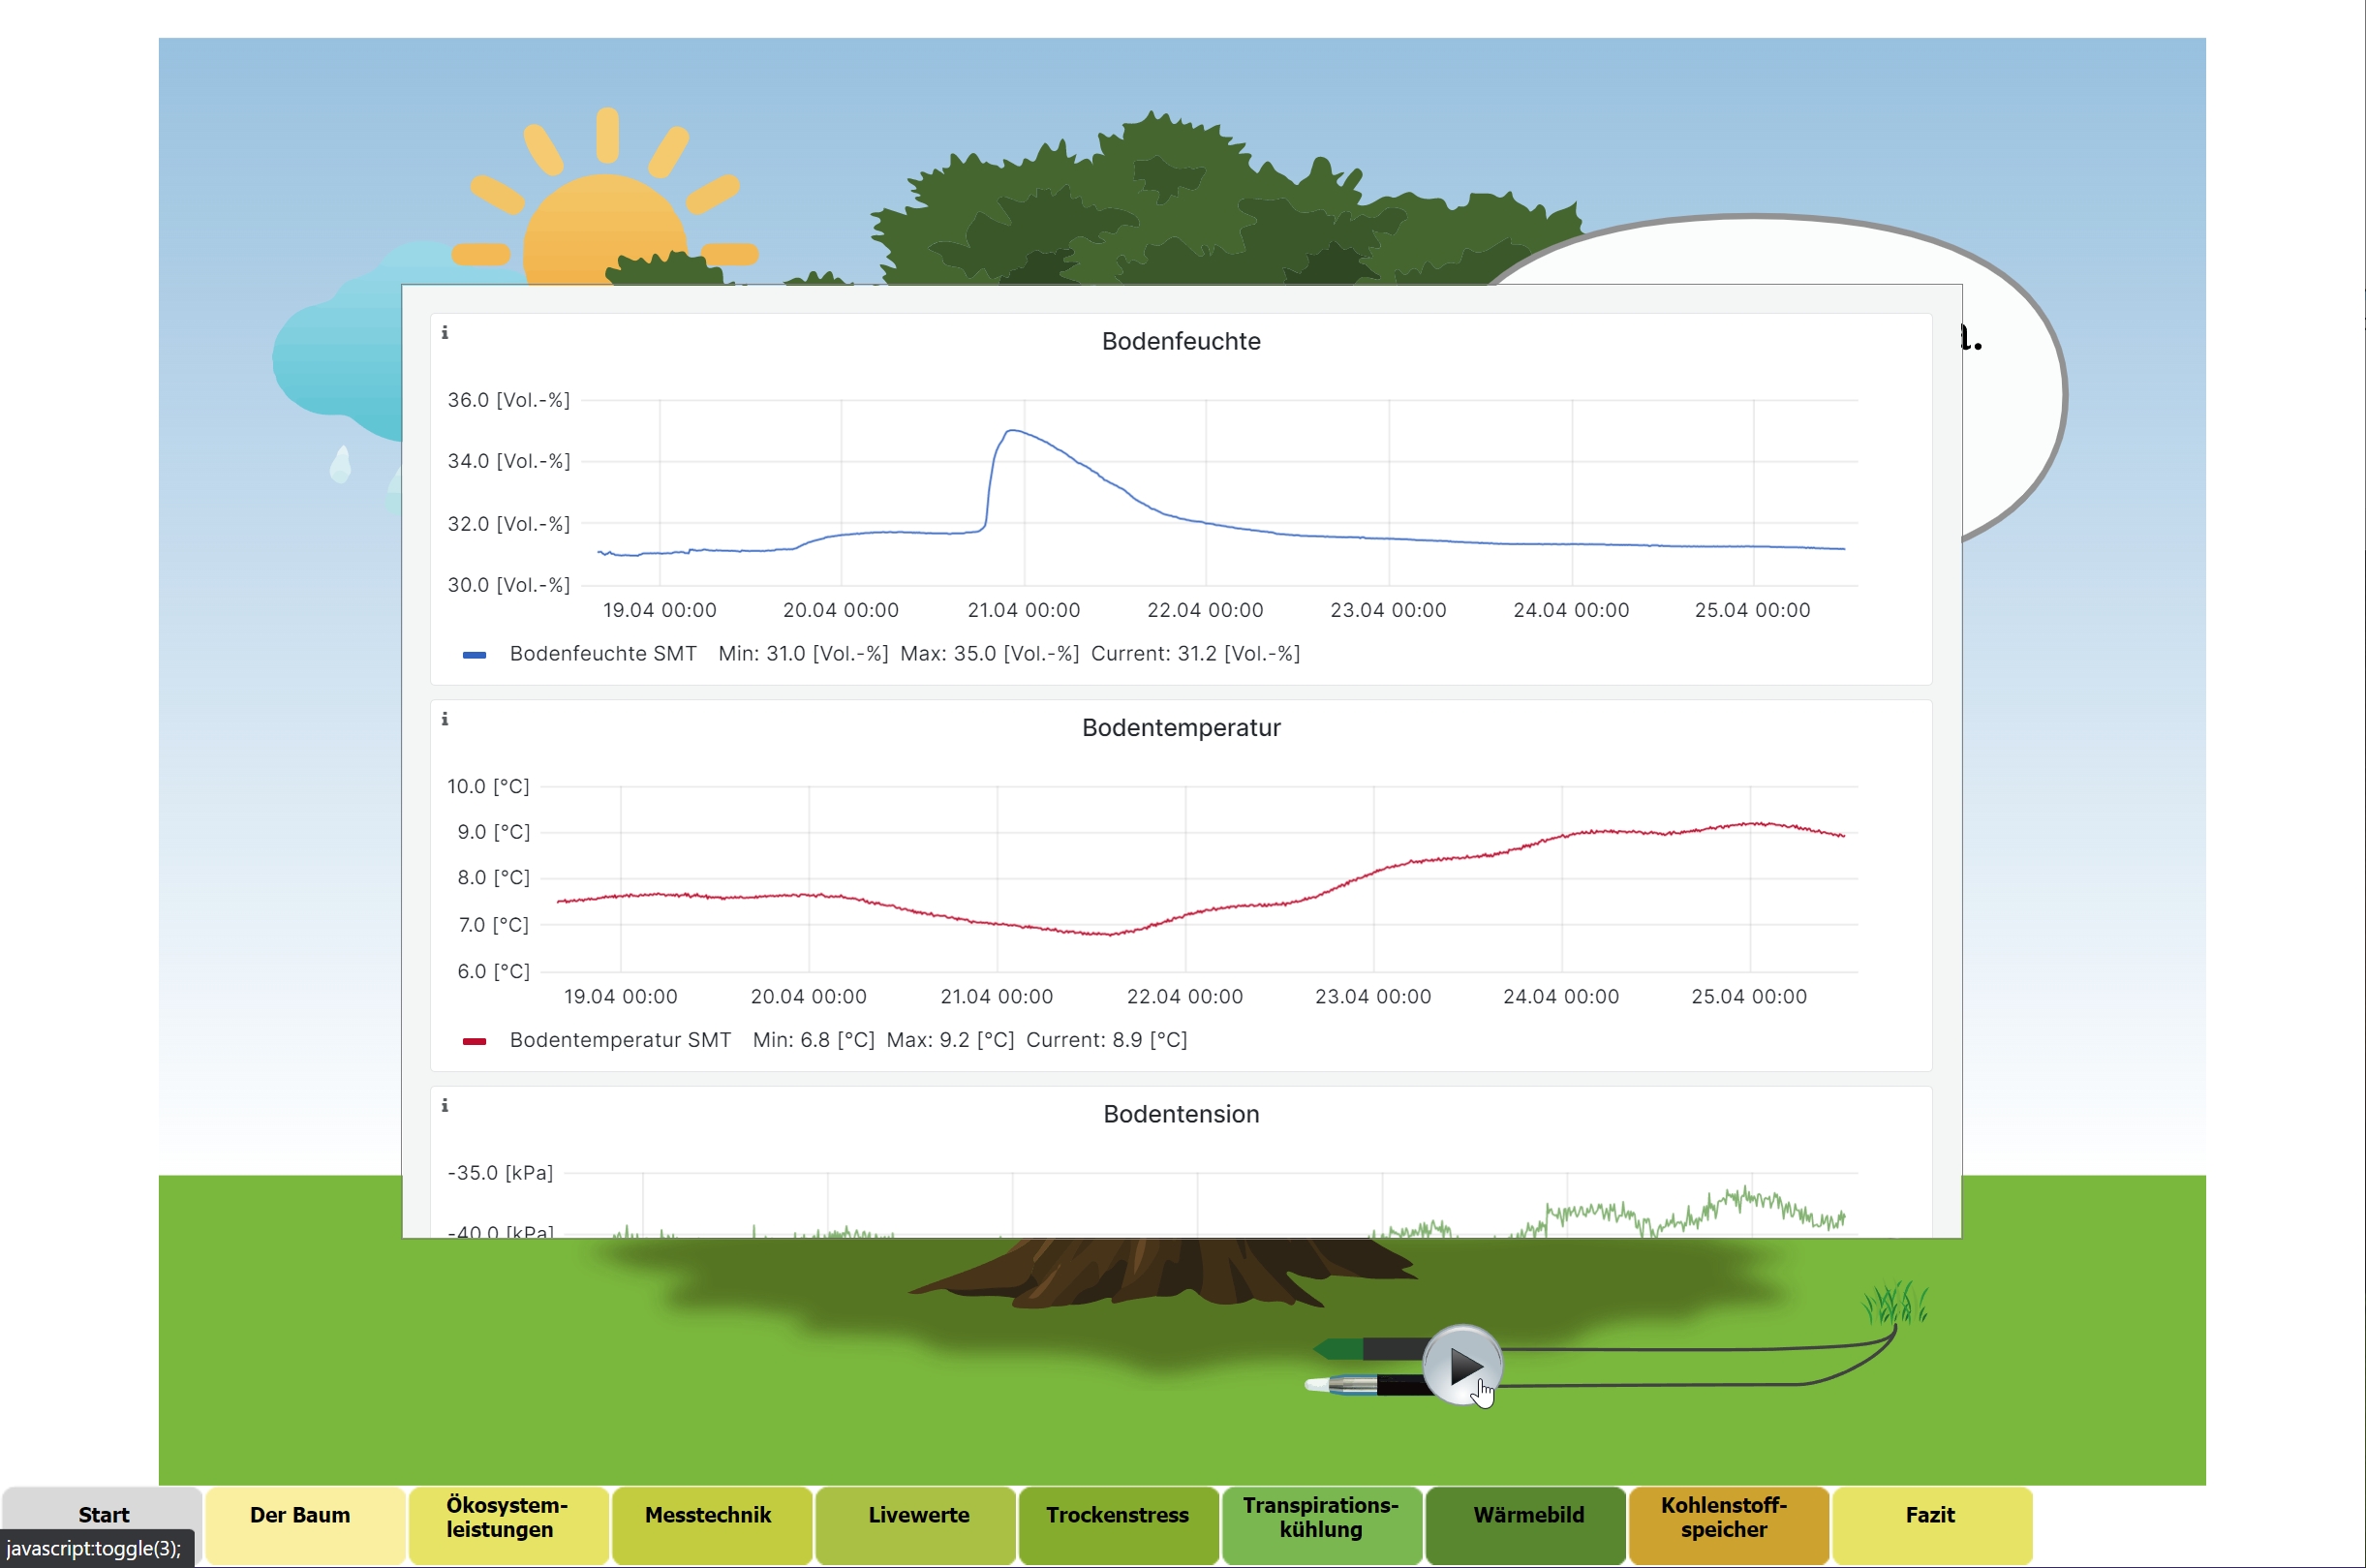
(Ready-To-Go-) Lysimeter
The application example shows a standard data management for a ready-to-go lysimeter with weather station with the following views:
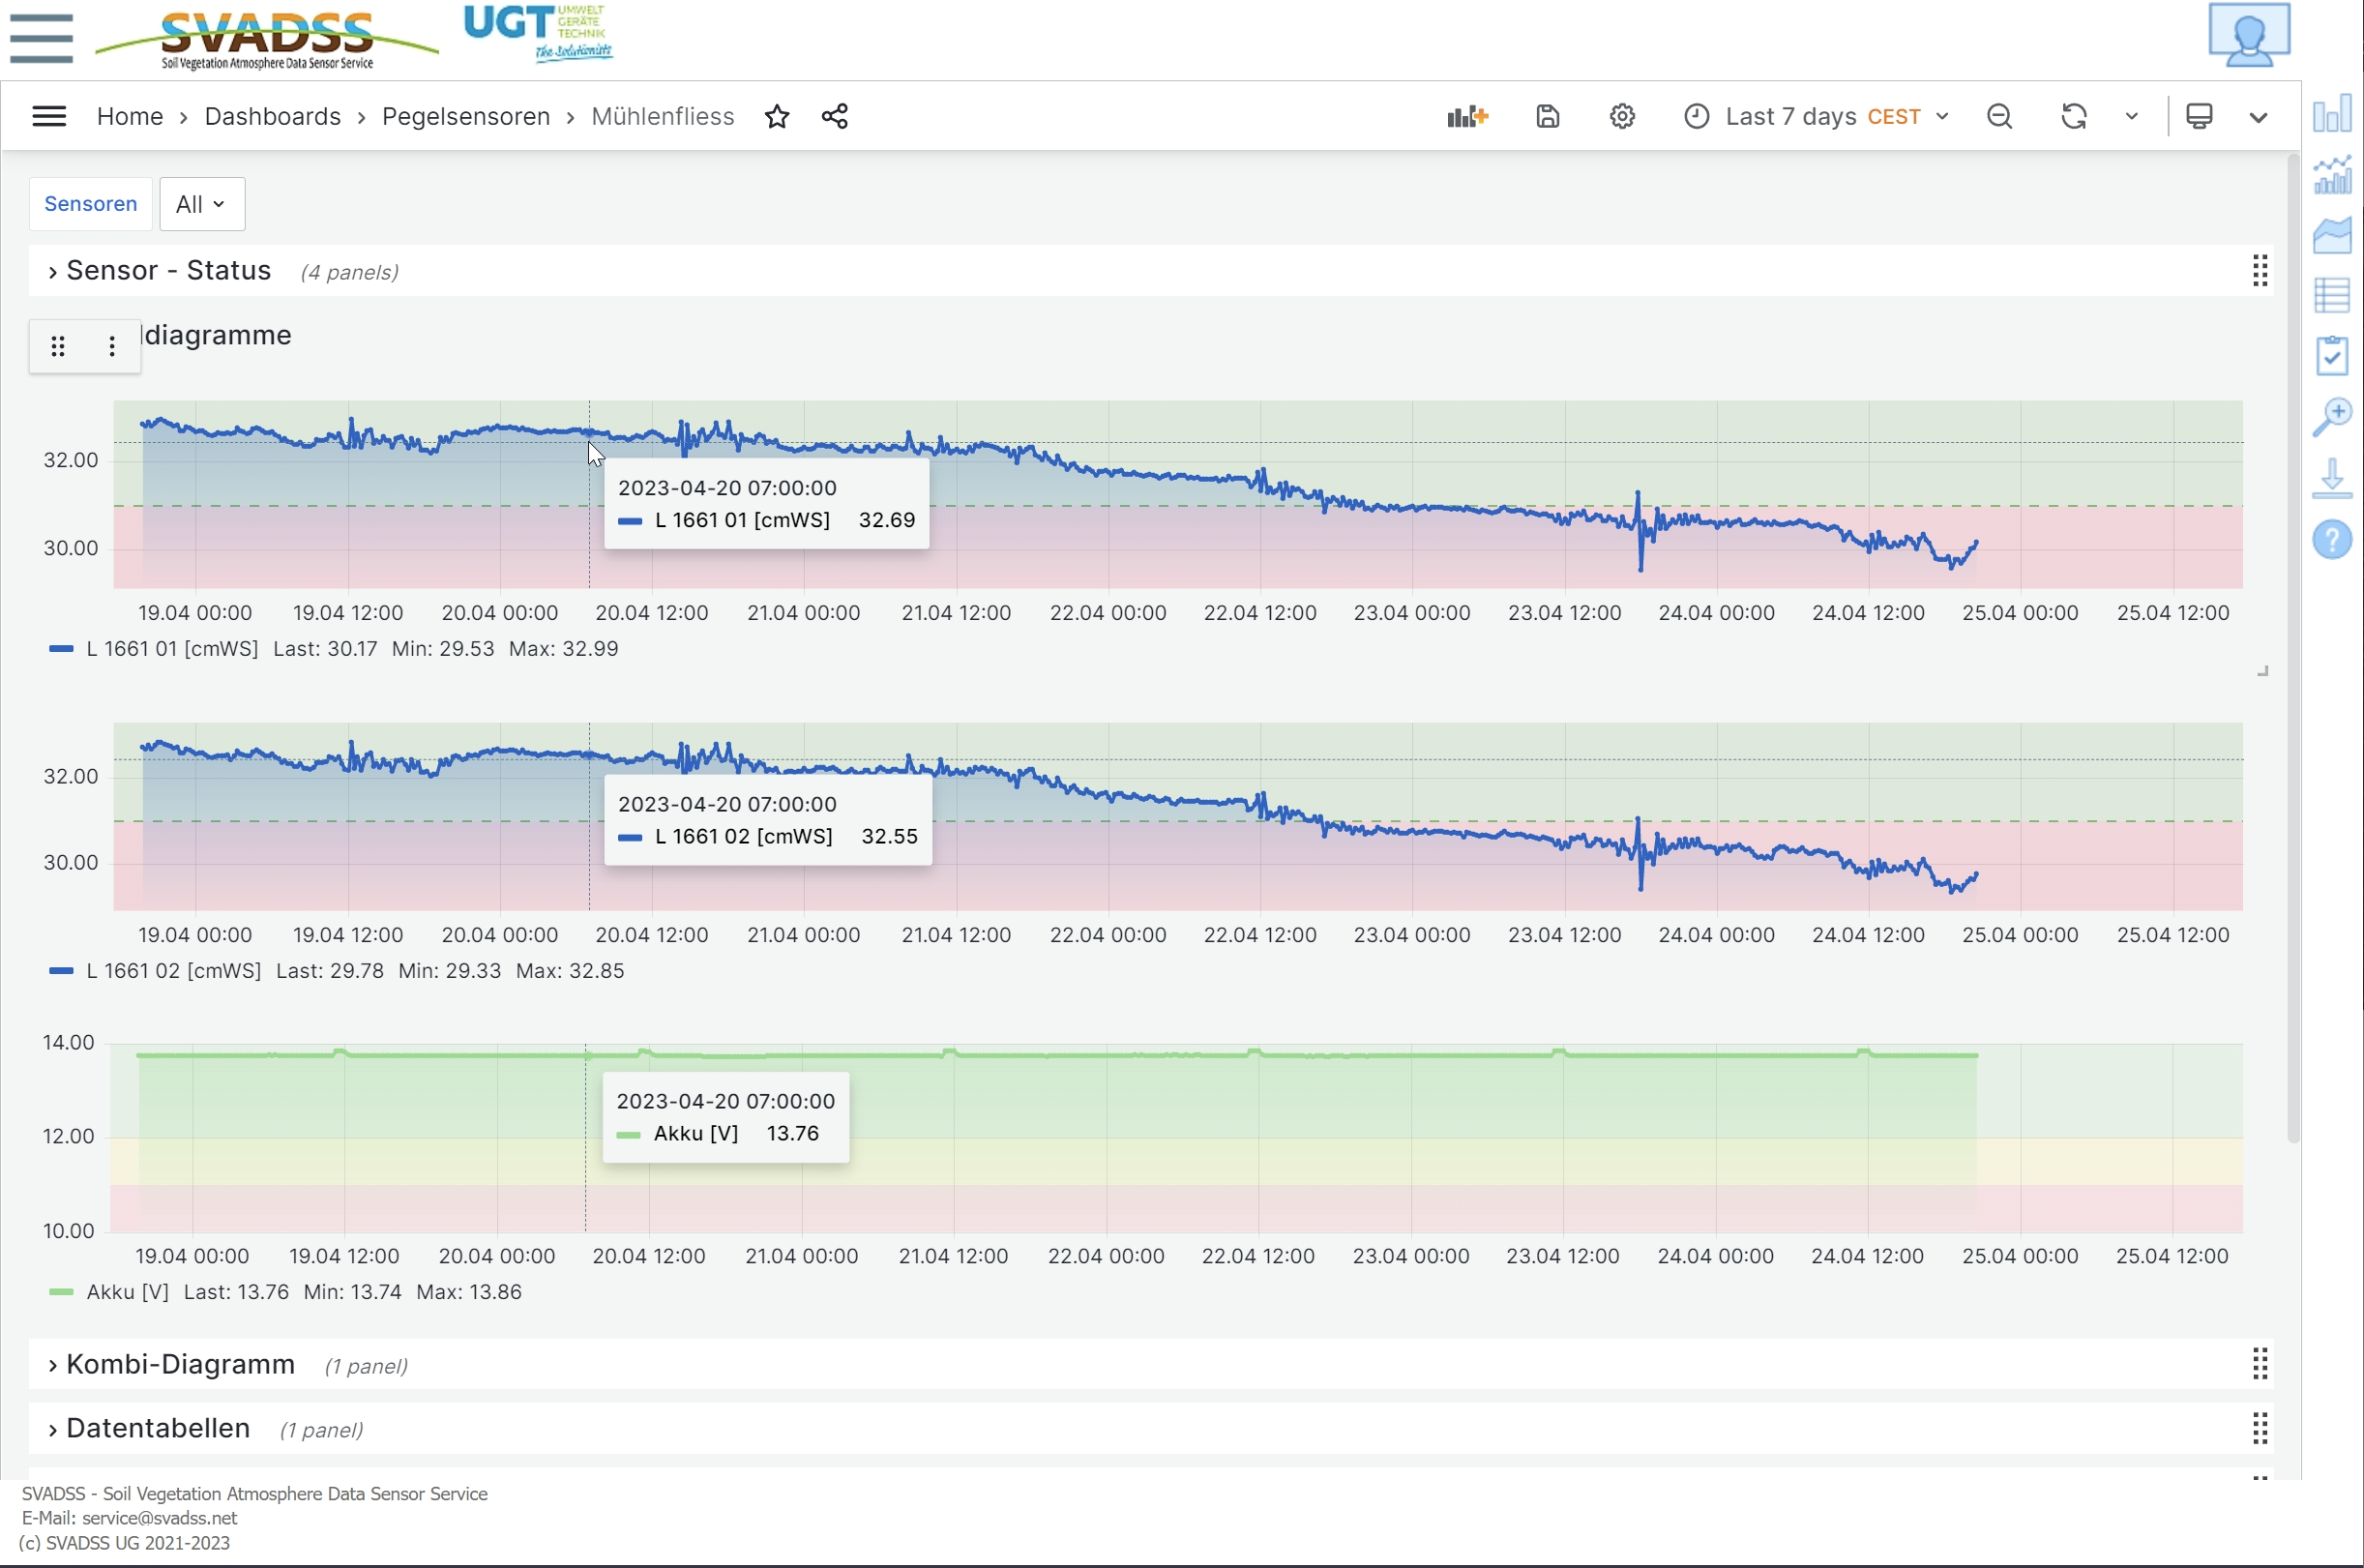
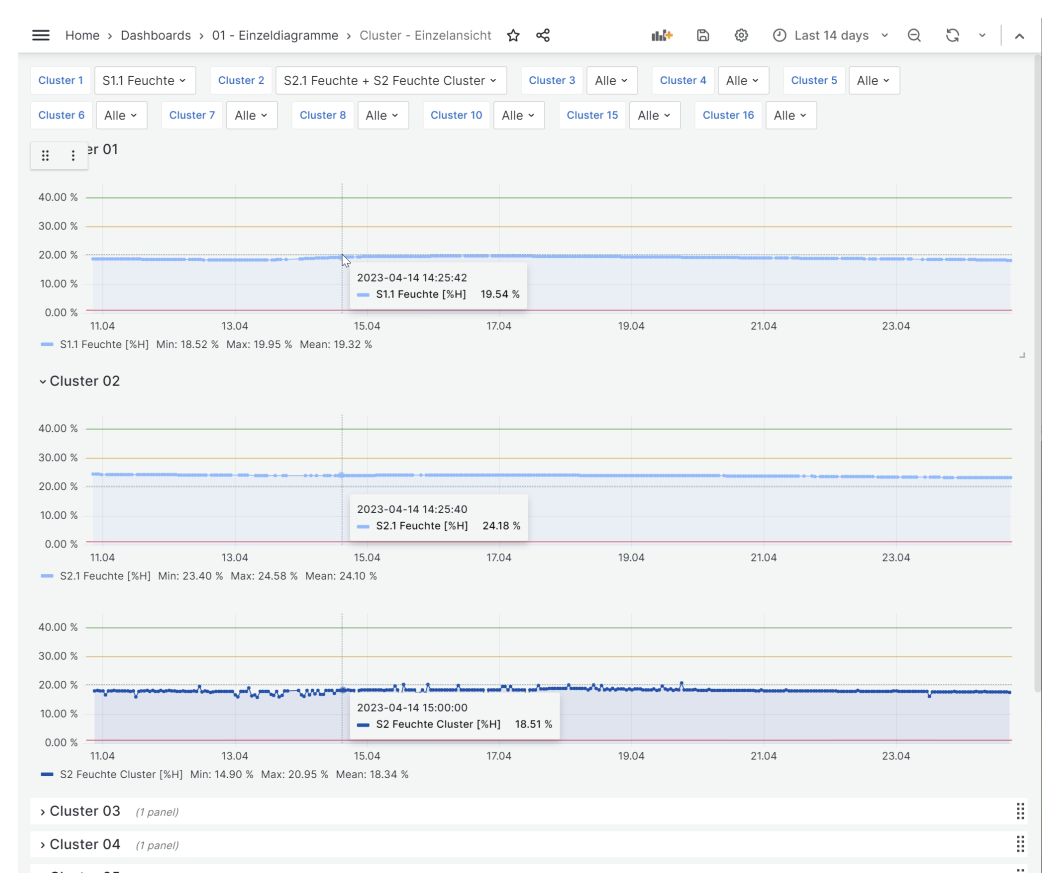
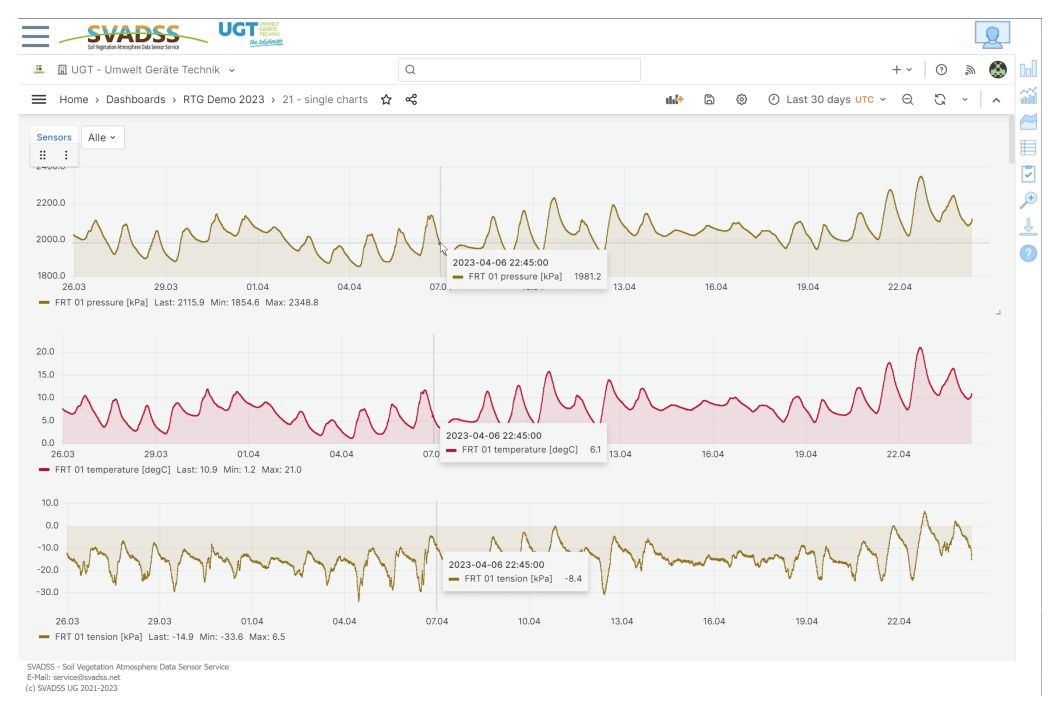
- Single charts
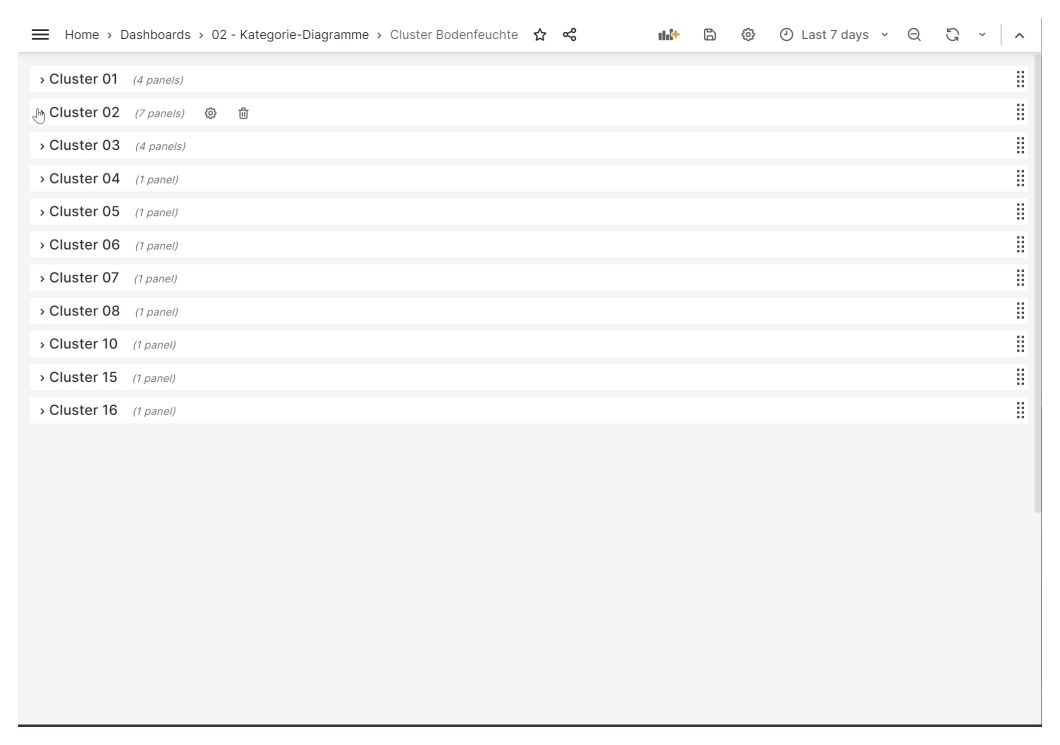
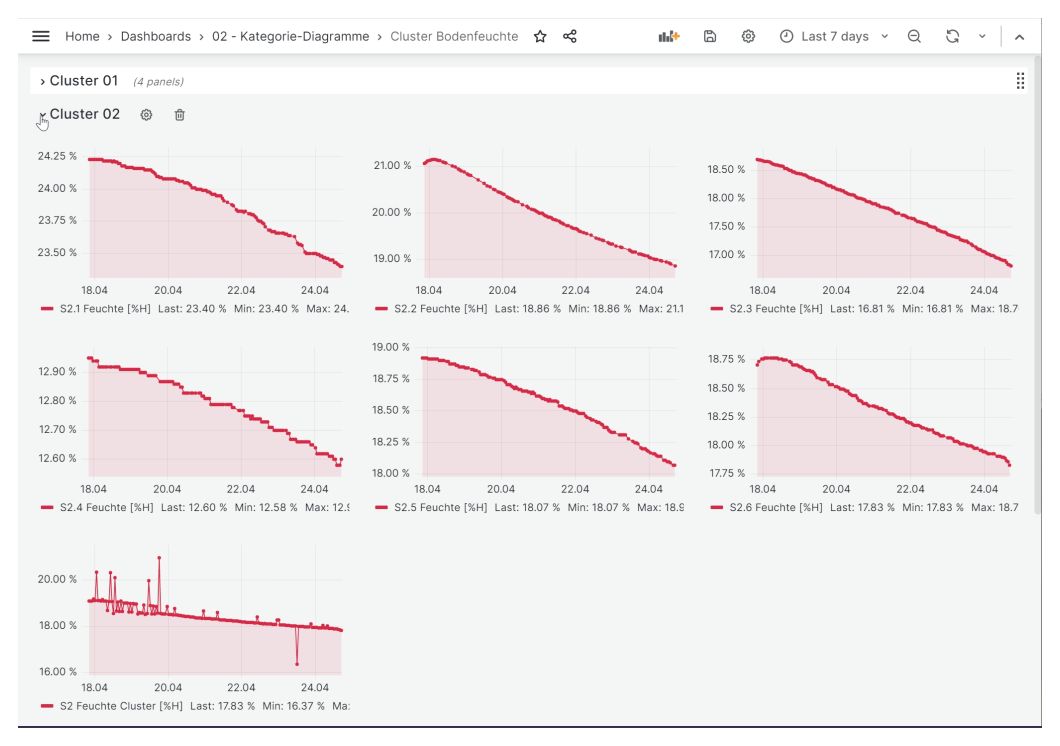
- Grouped charts by category
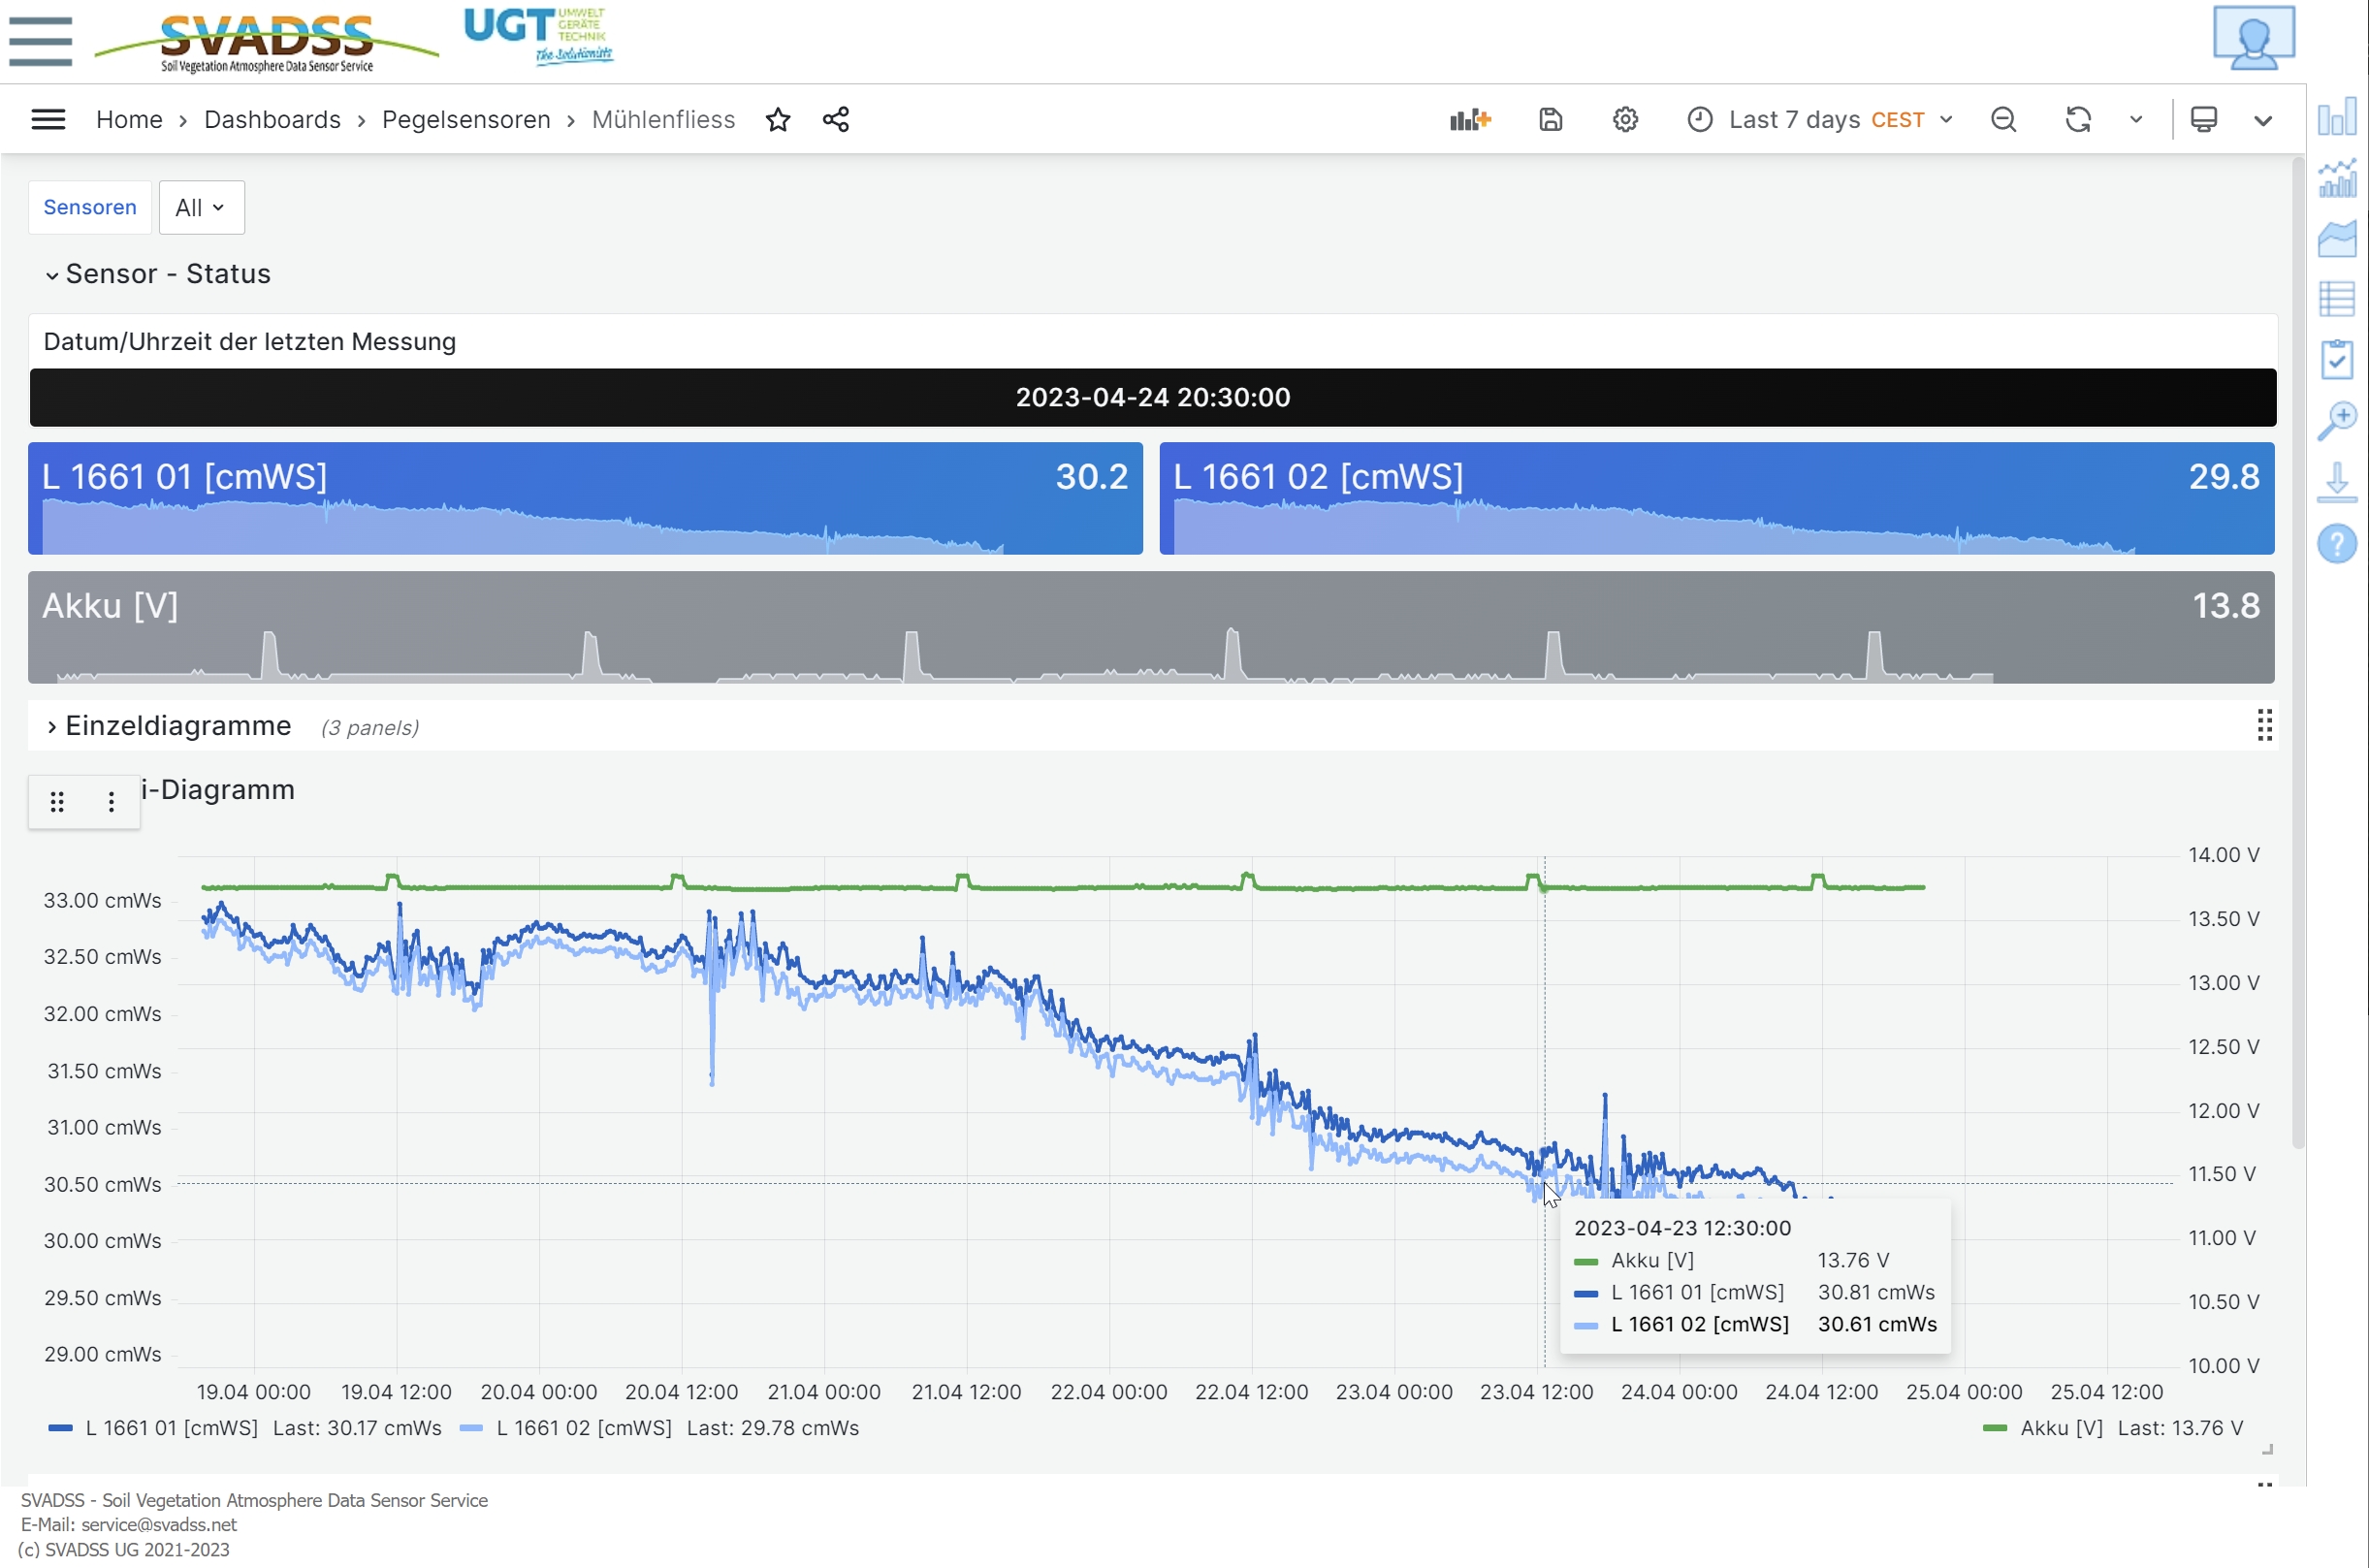
- Combined charts across all sensors
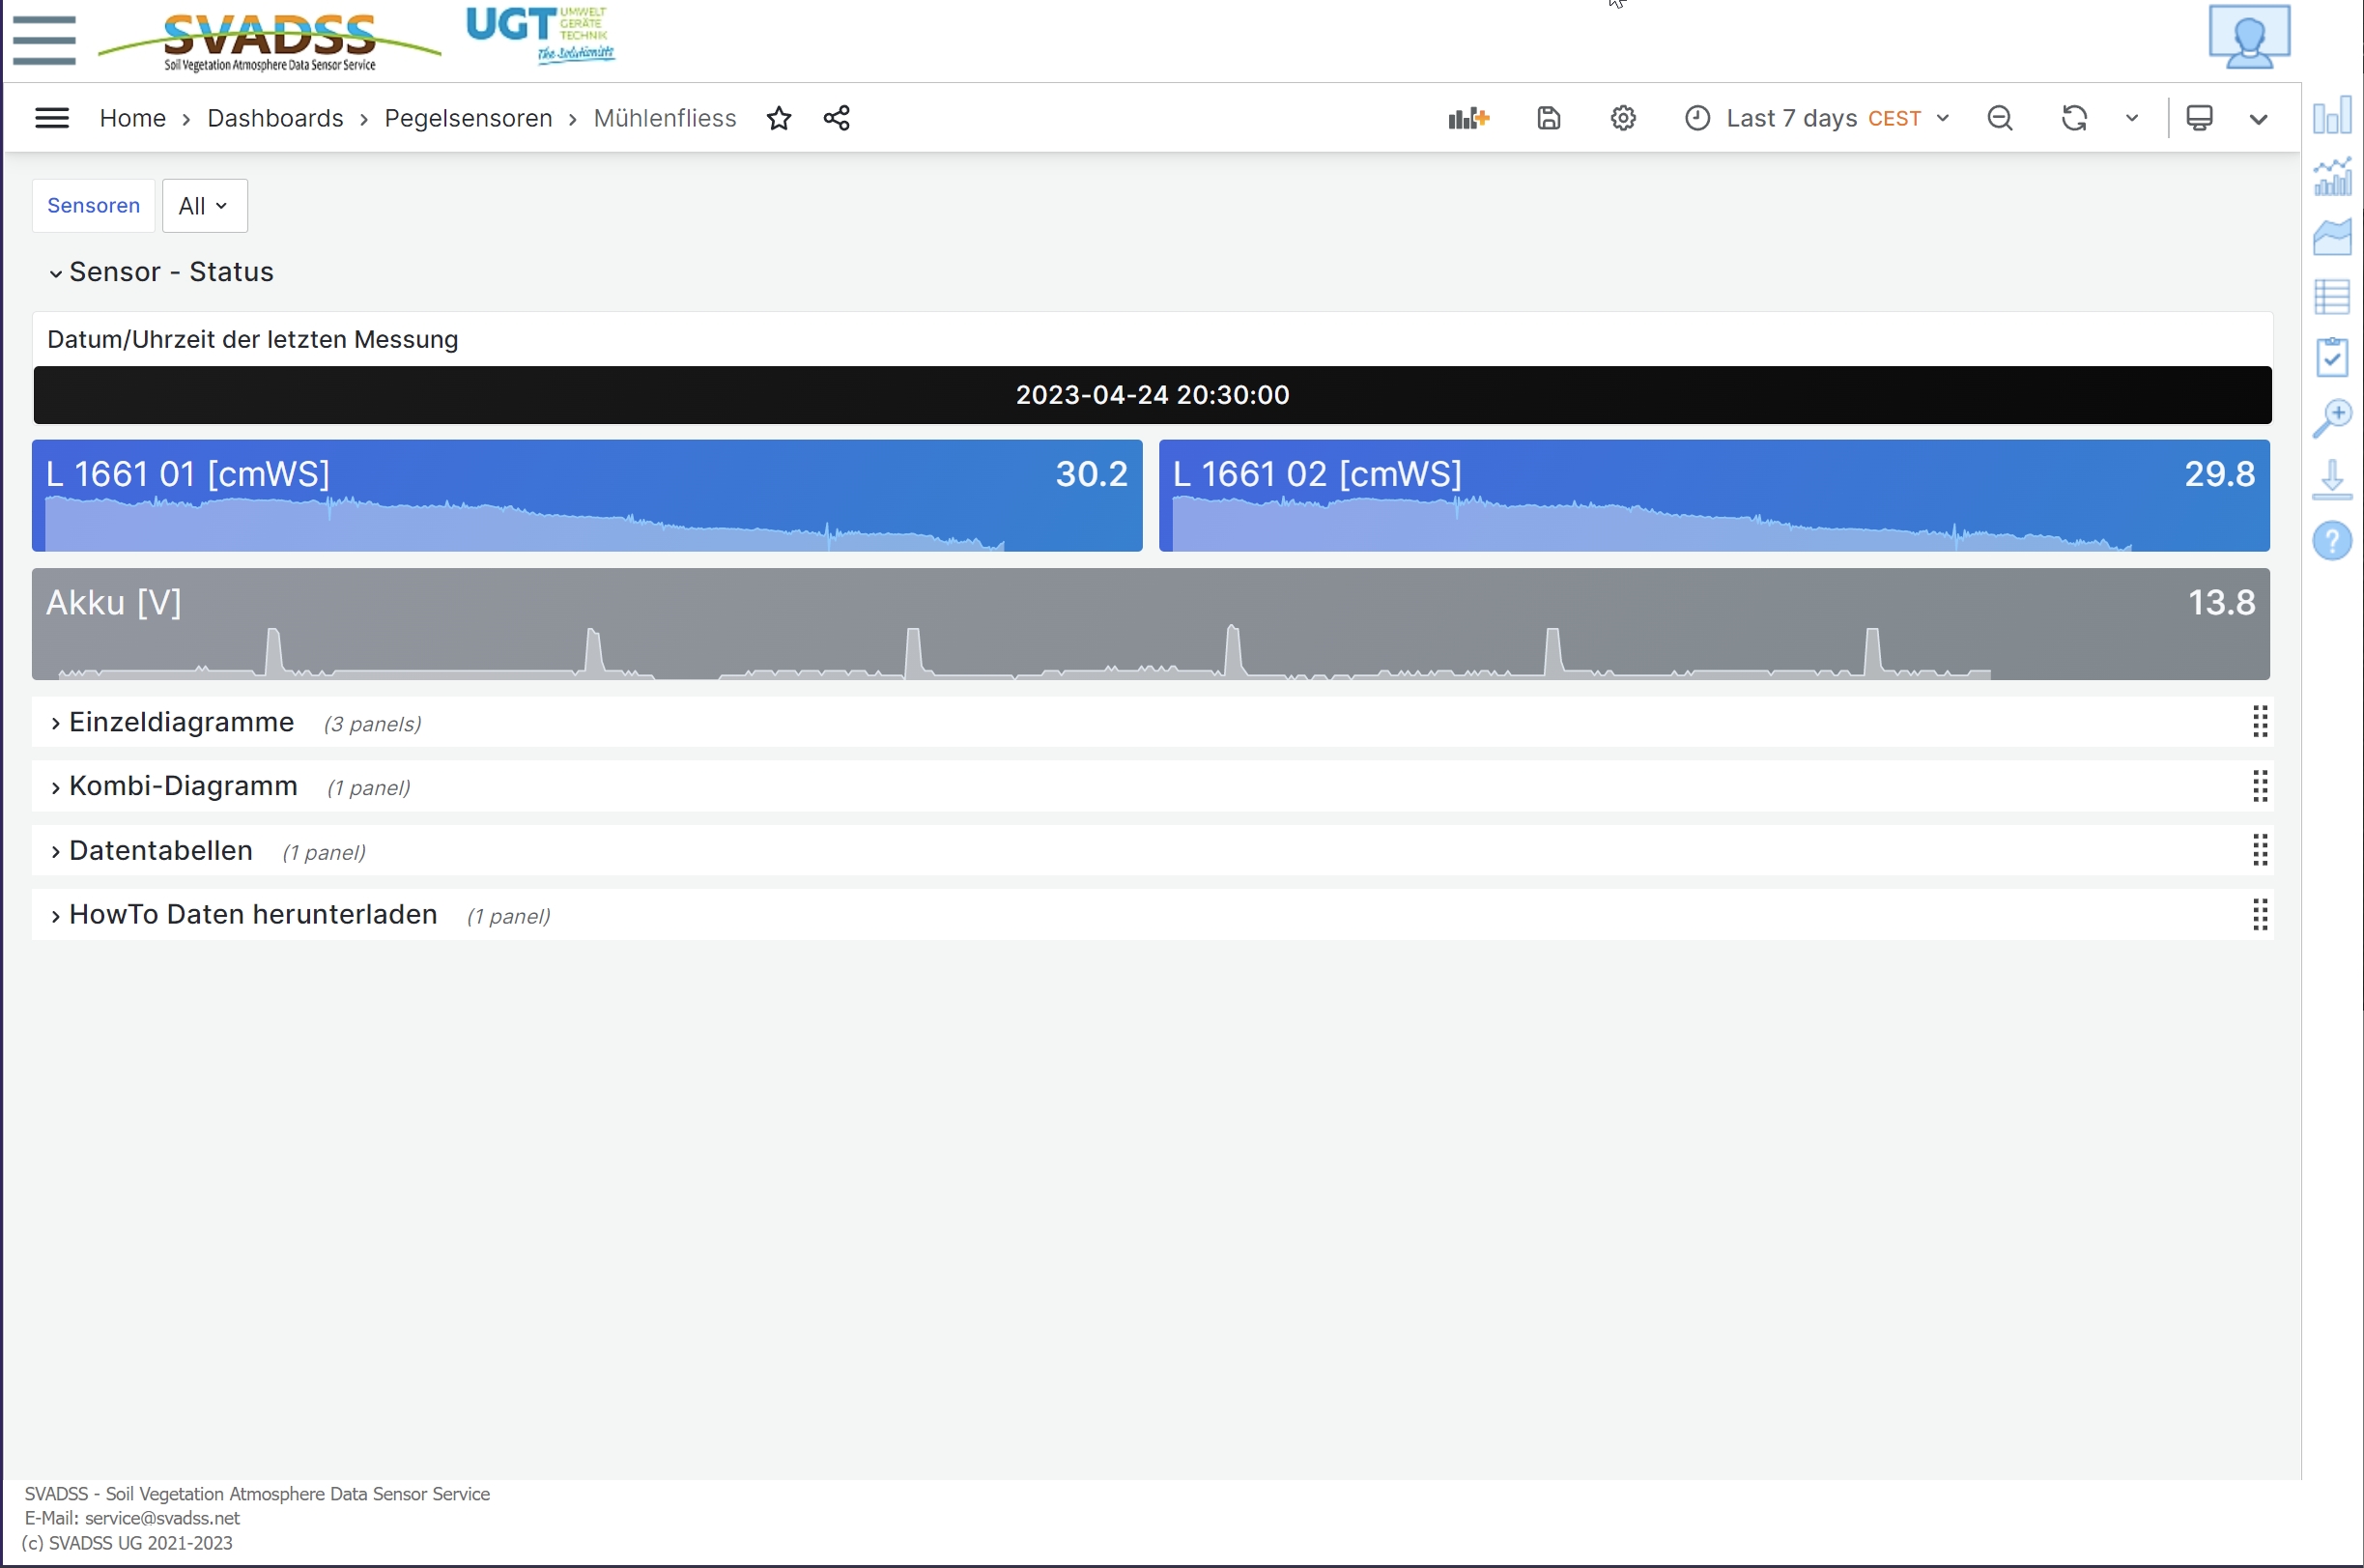
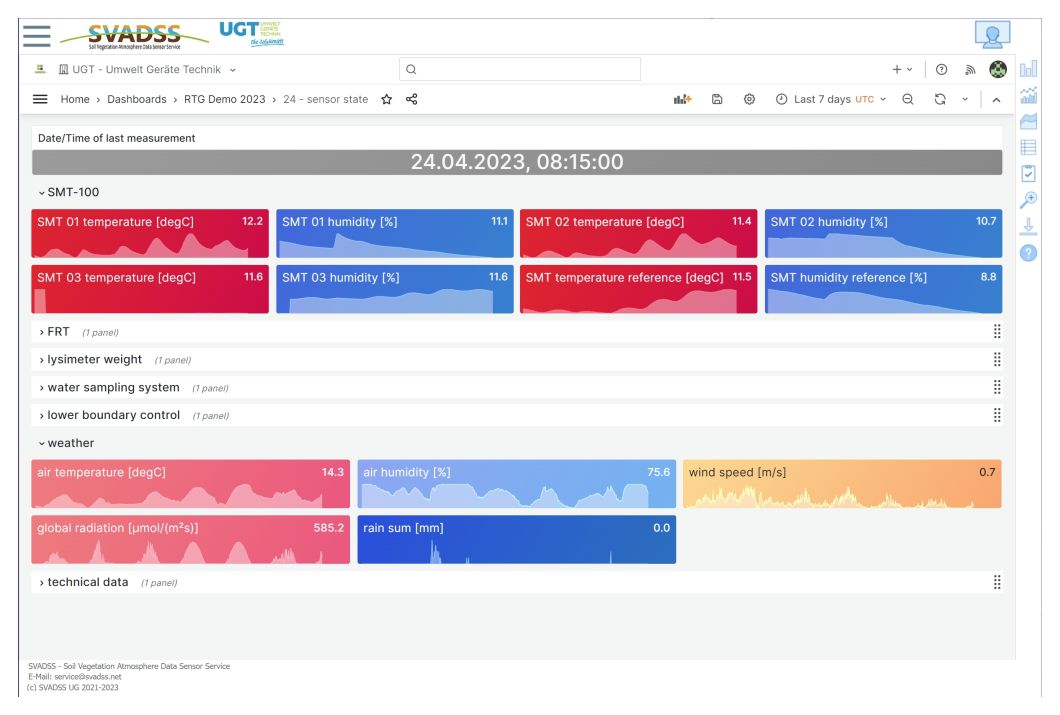
- Sensor state
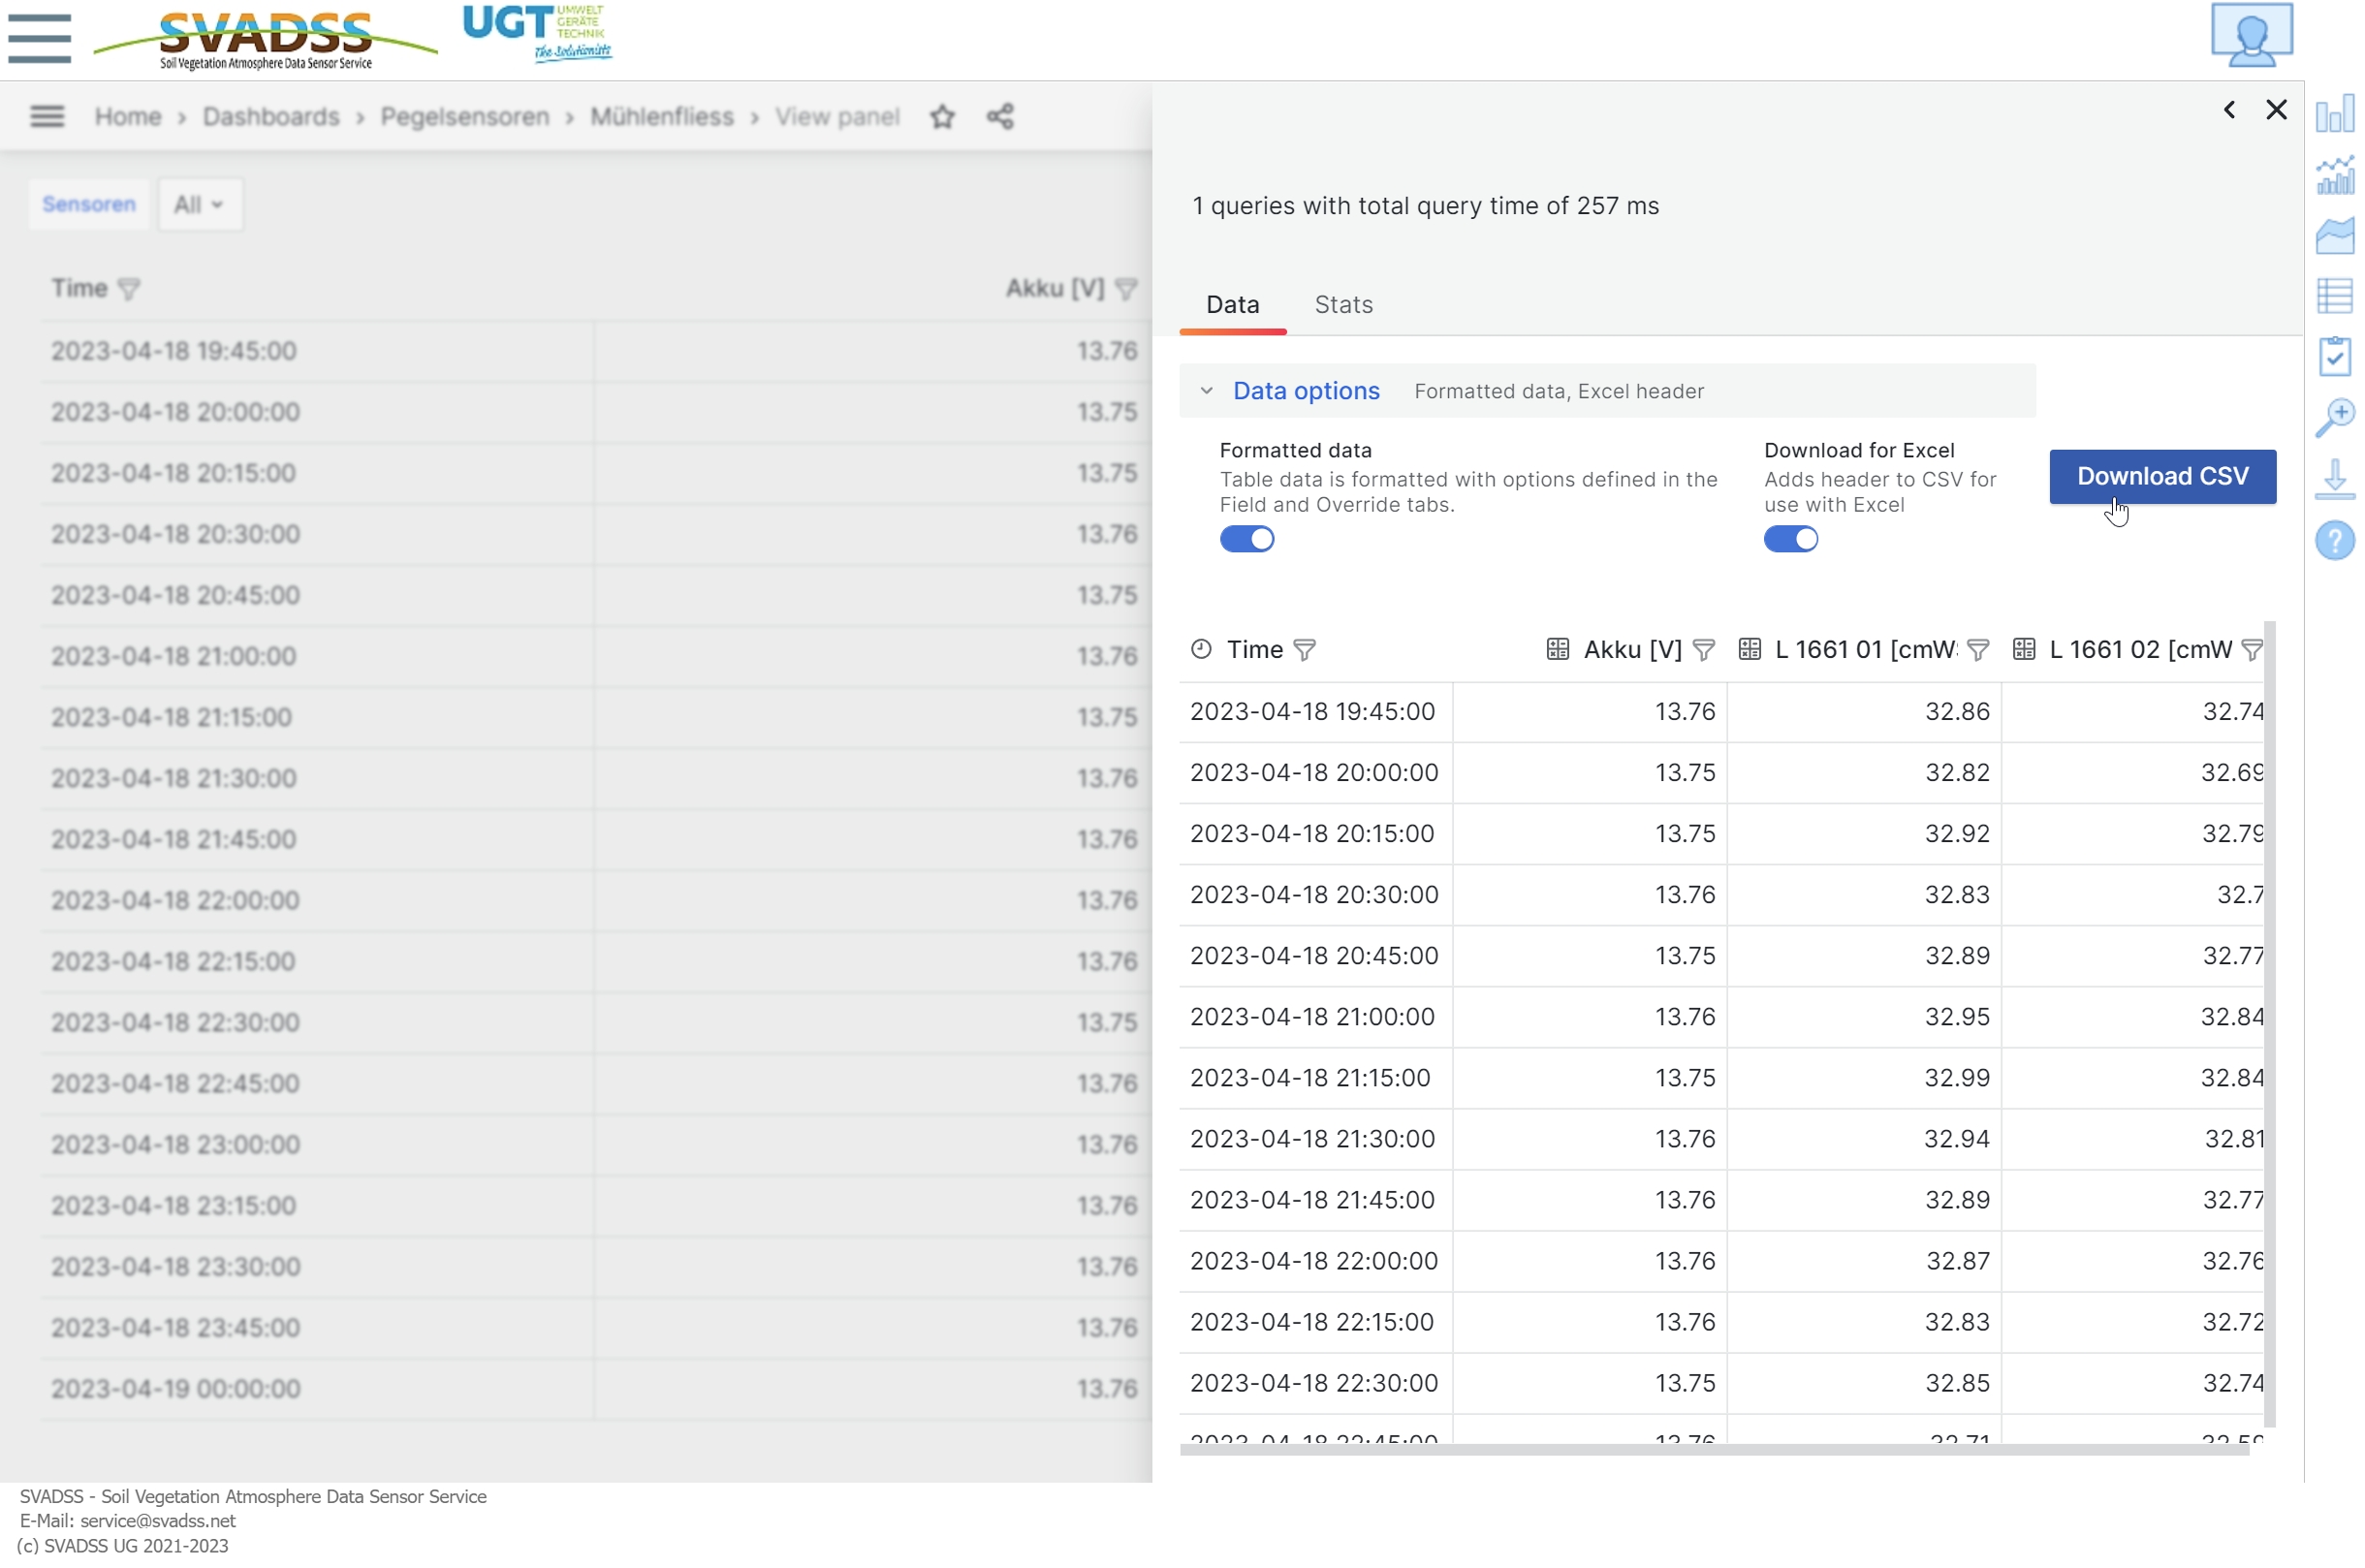
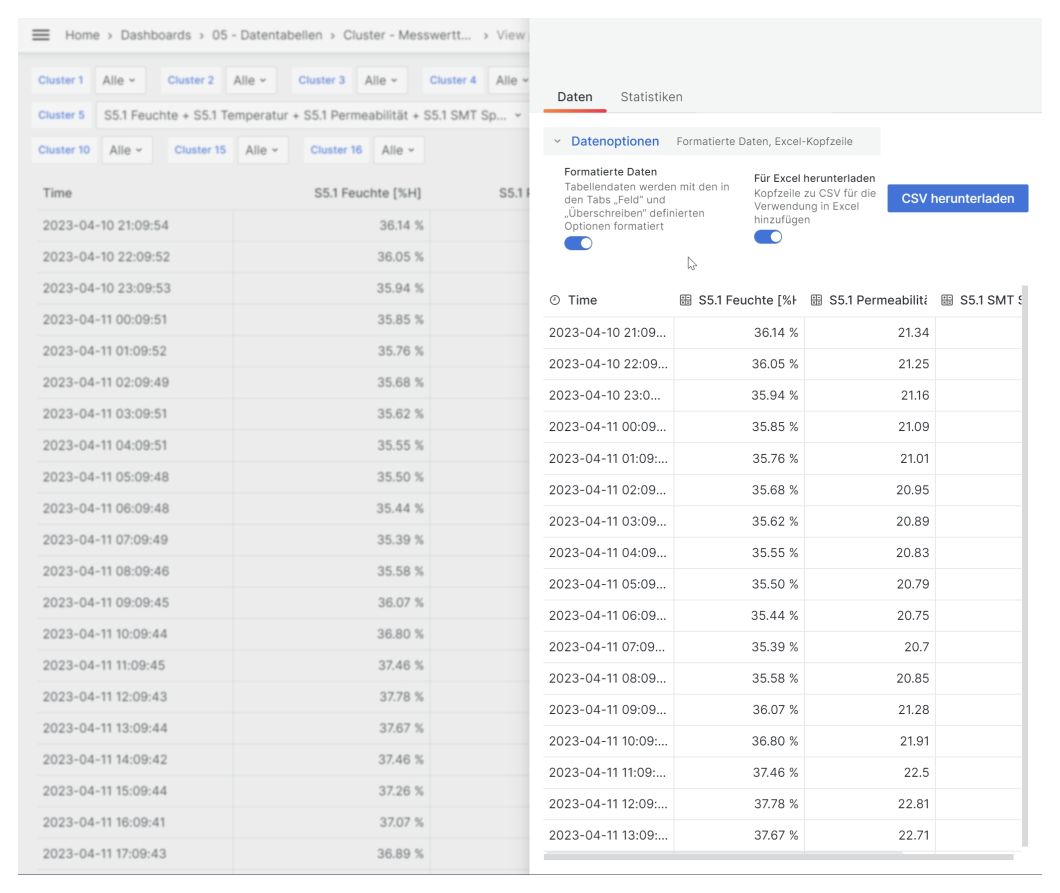
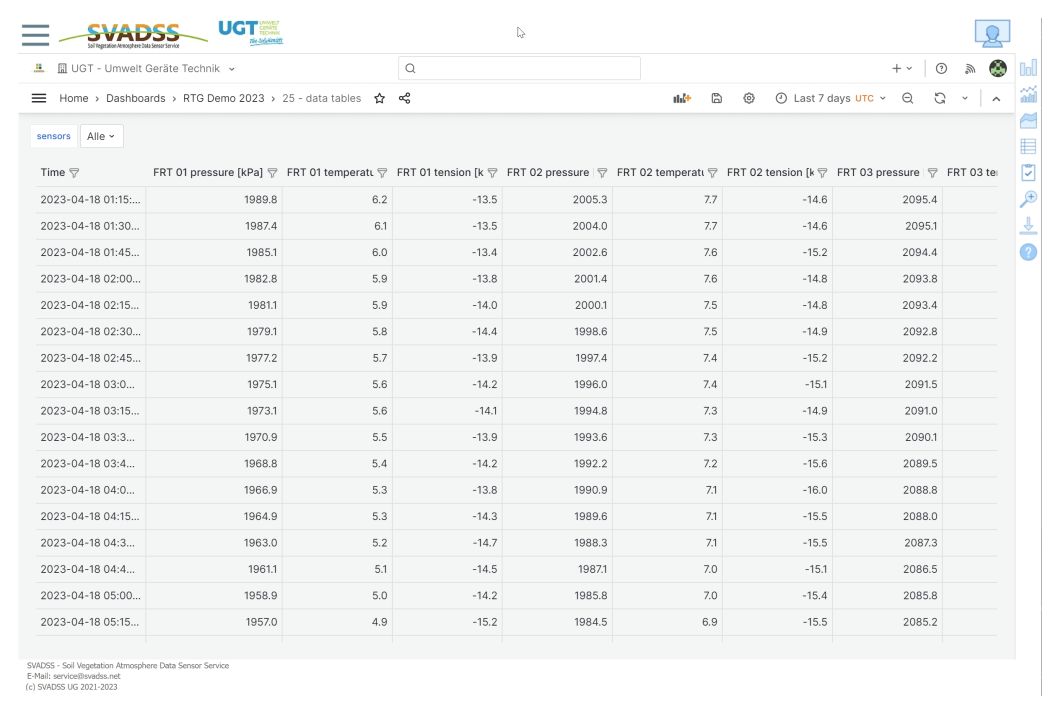
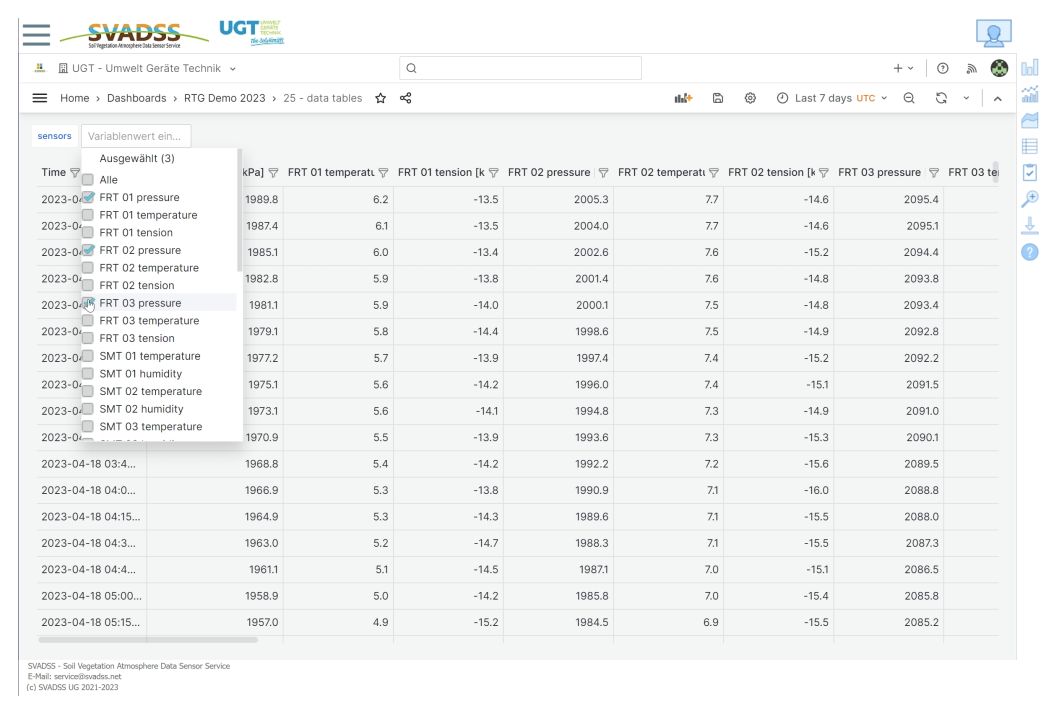
- Table view and data download
- Convenient chart for visual data analysis of long time series
The visualizations are also used in a modified form in multi-lysimeter systems.
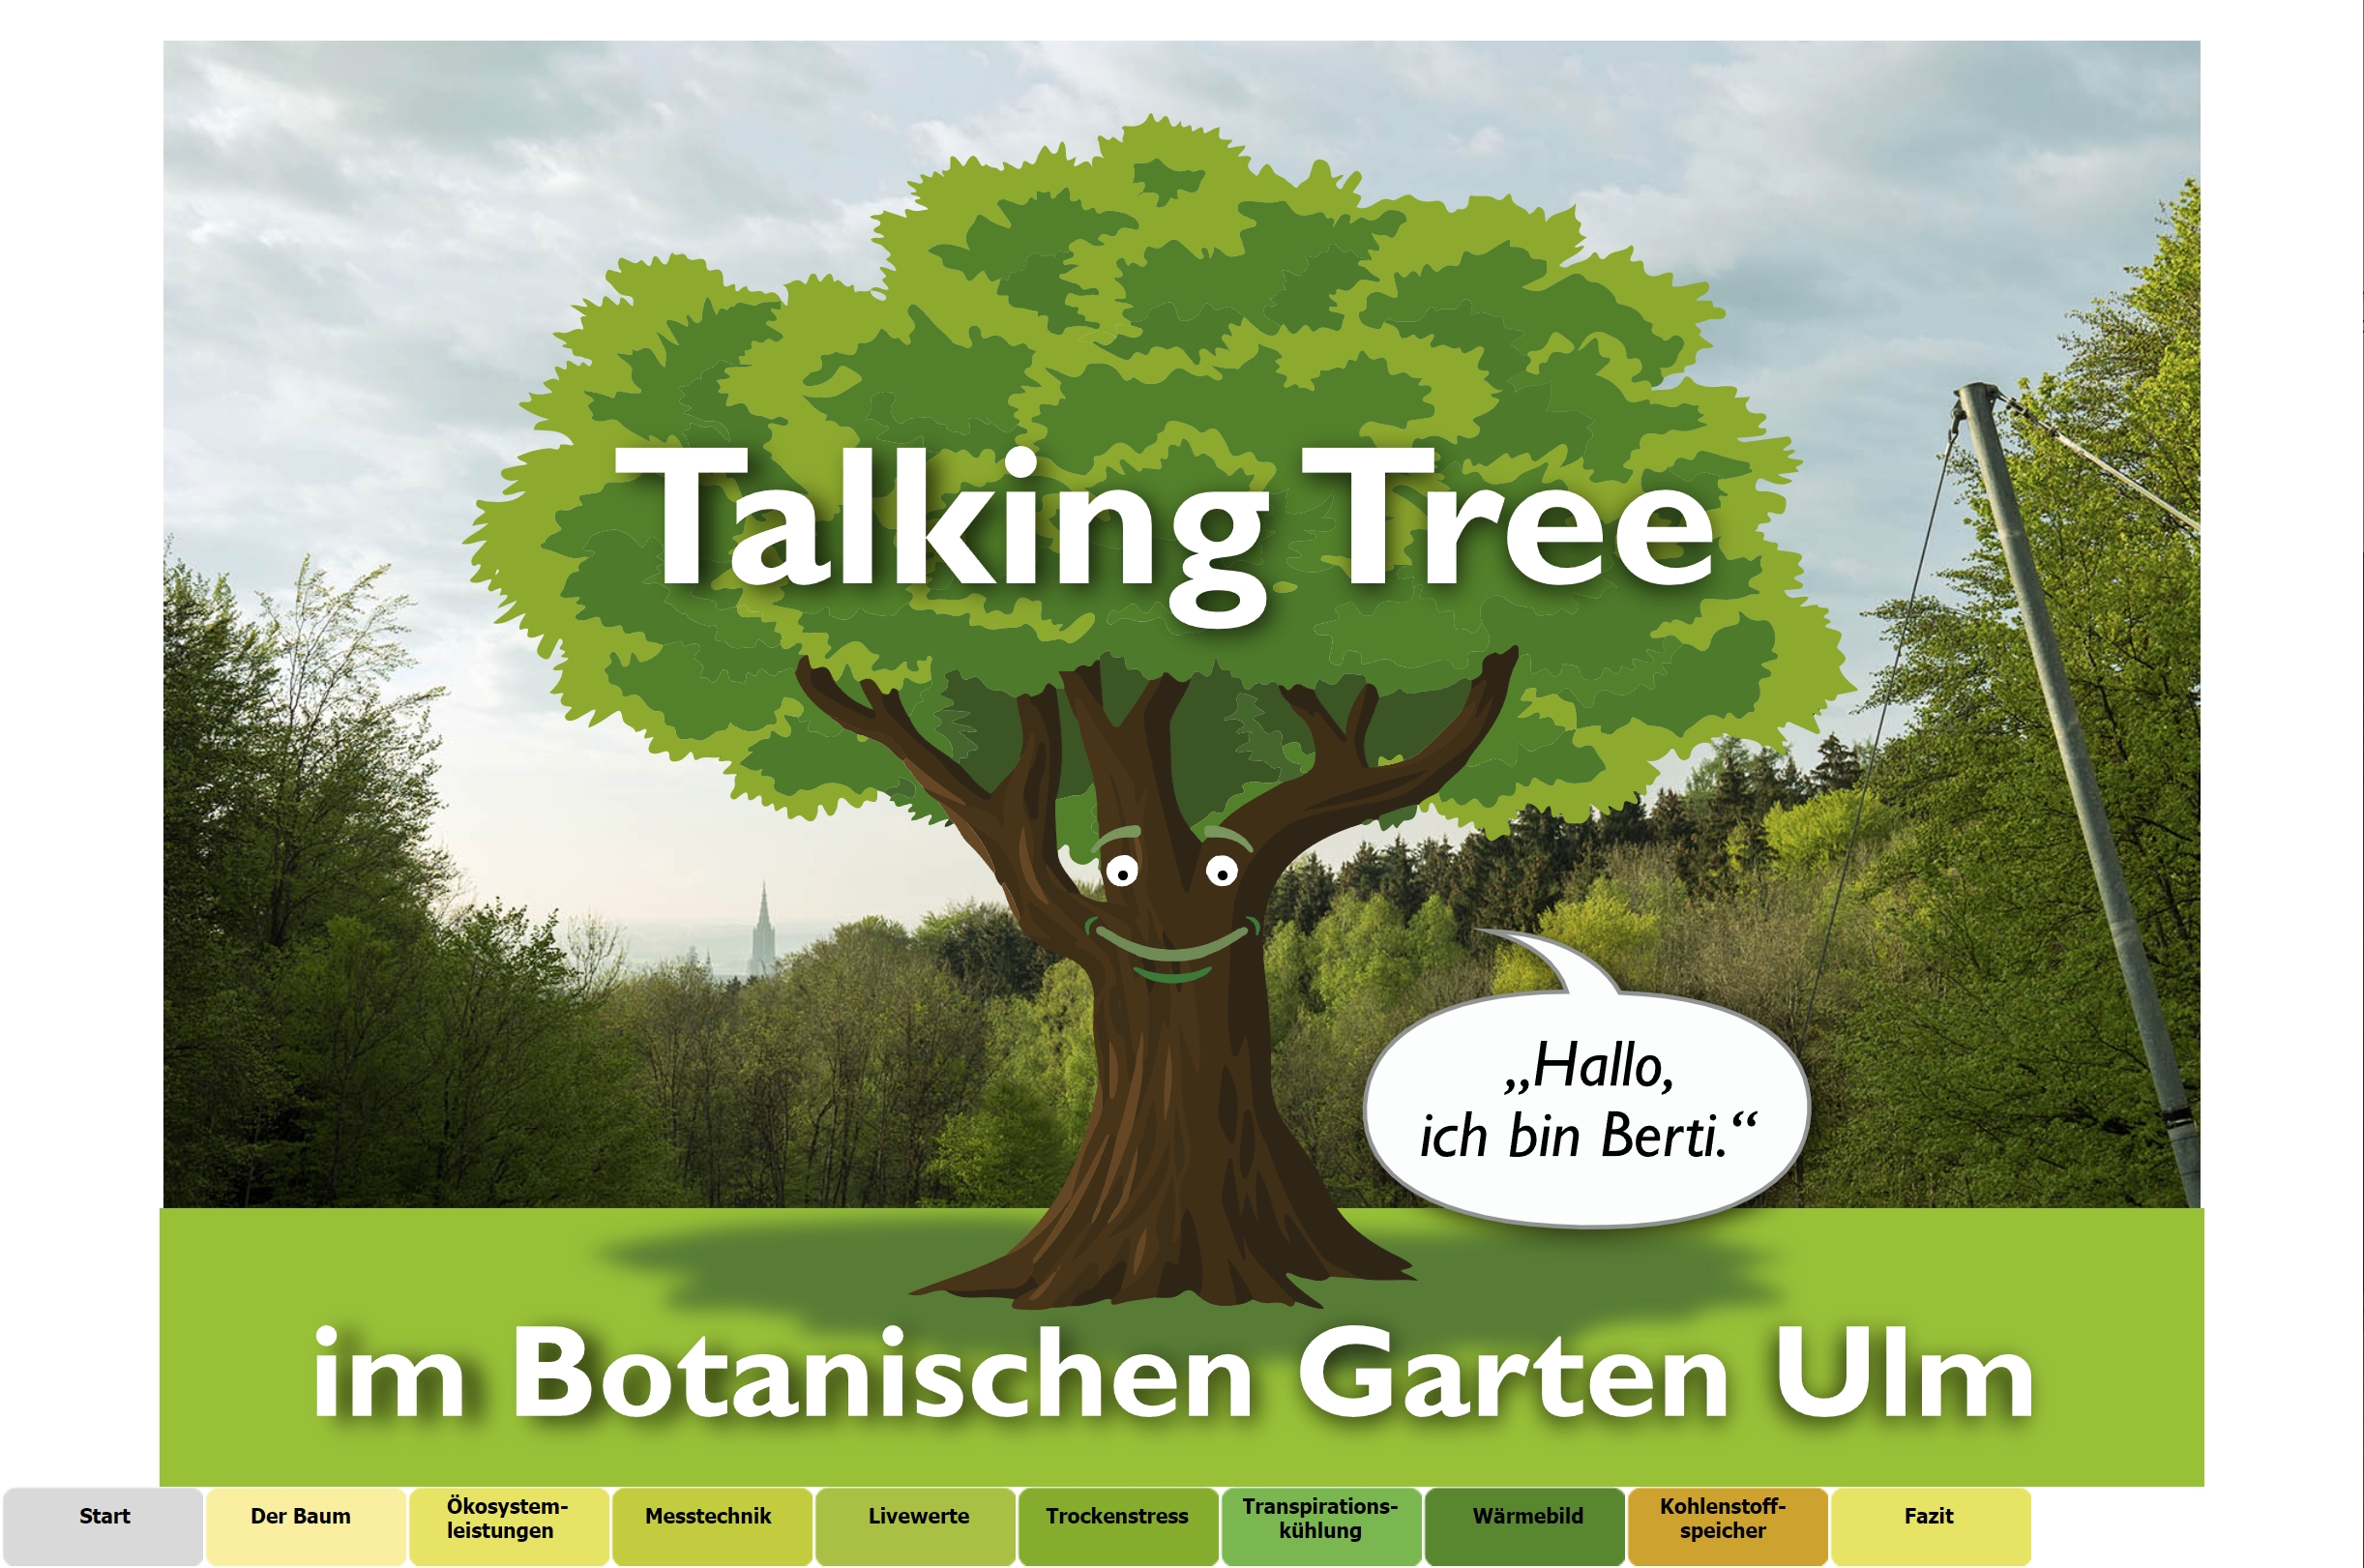
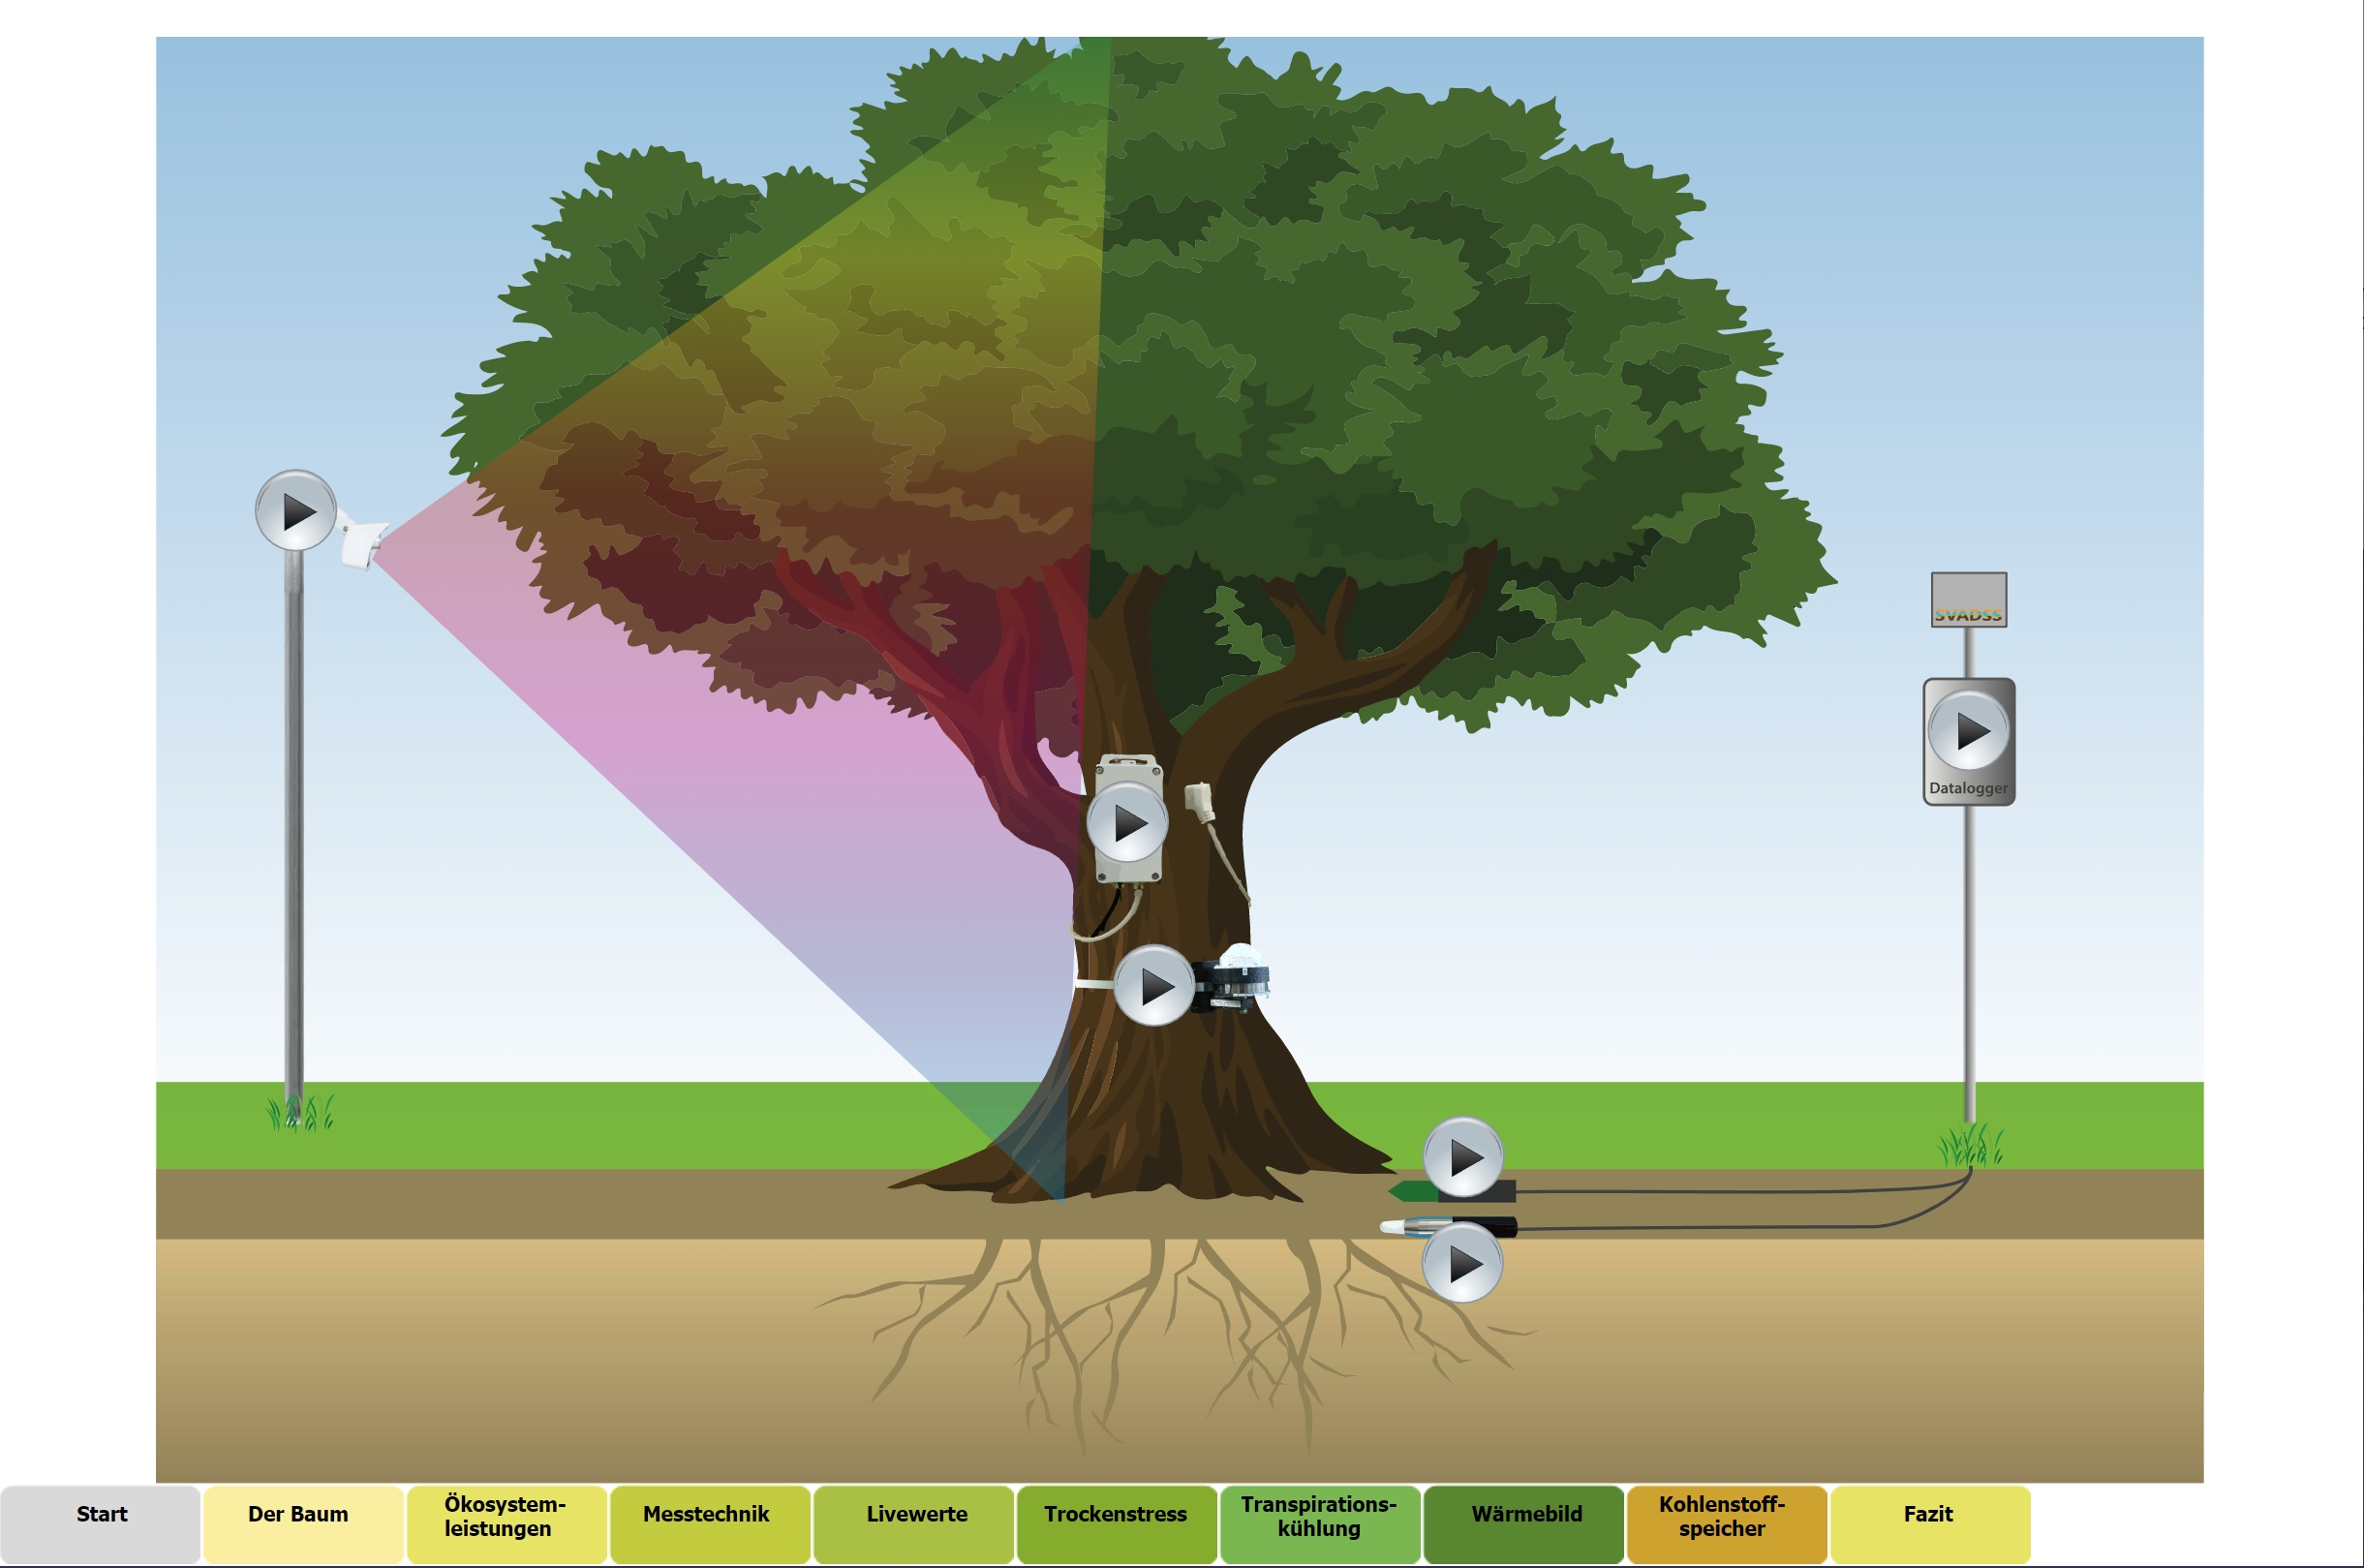
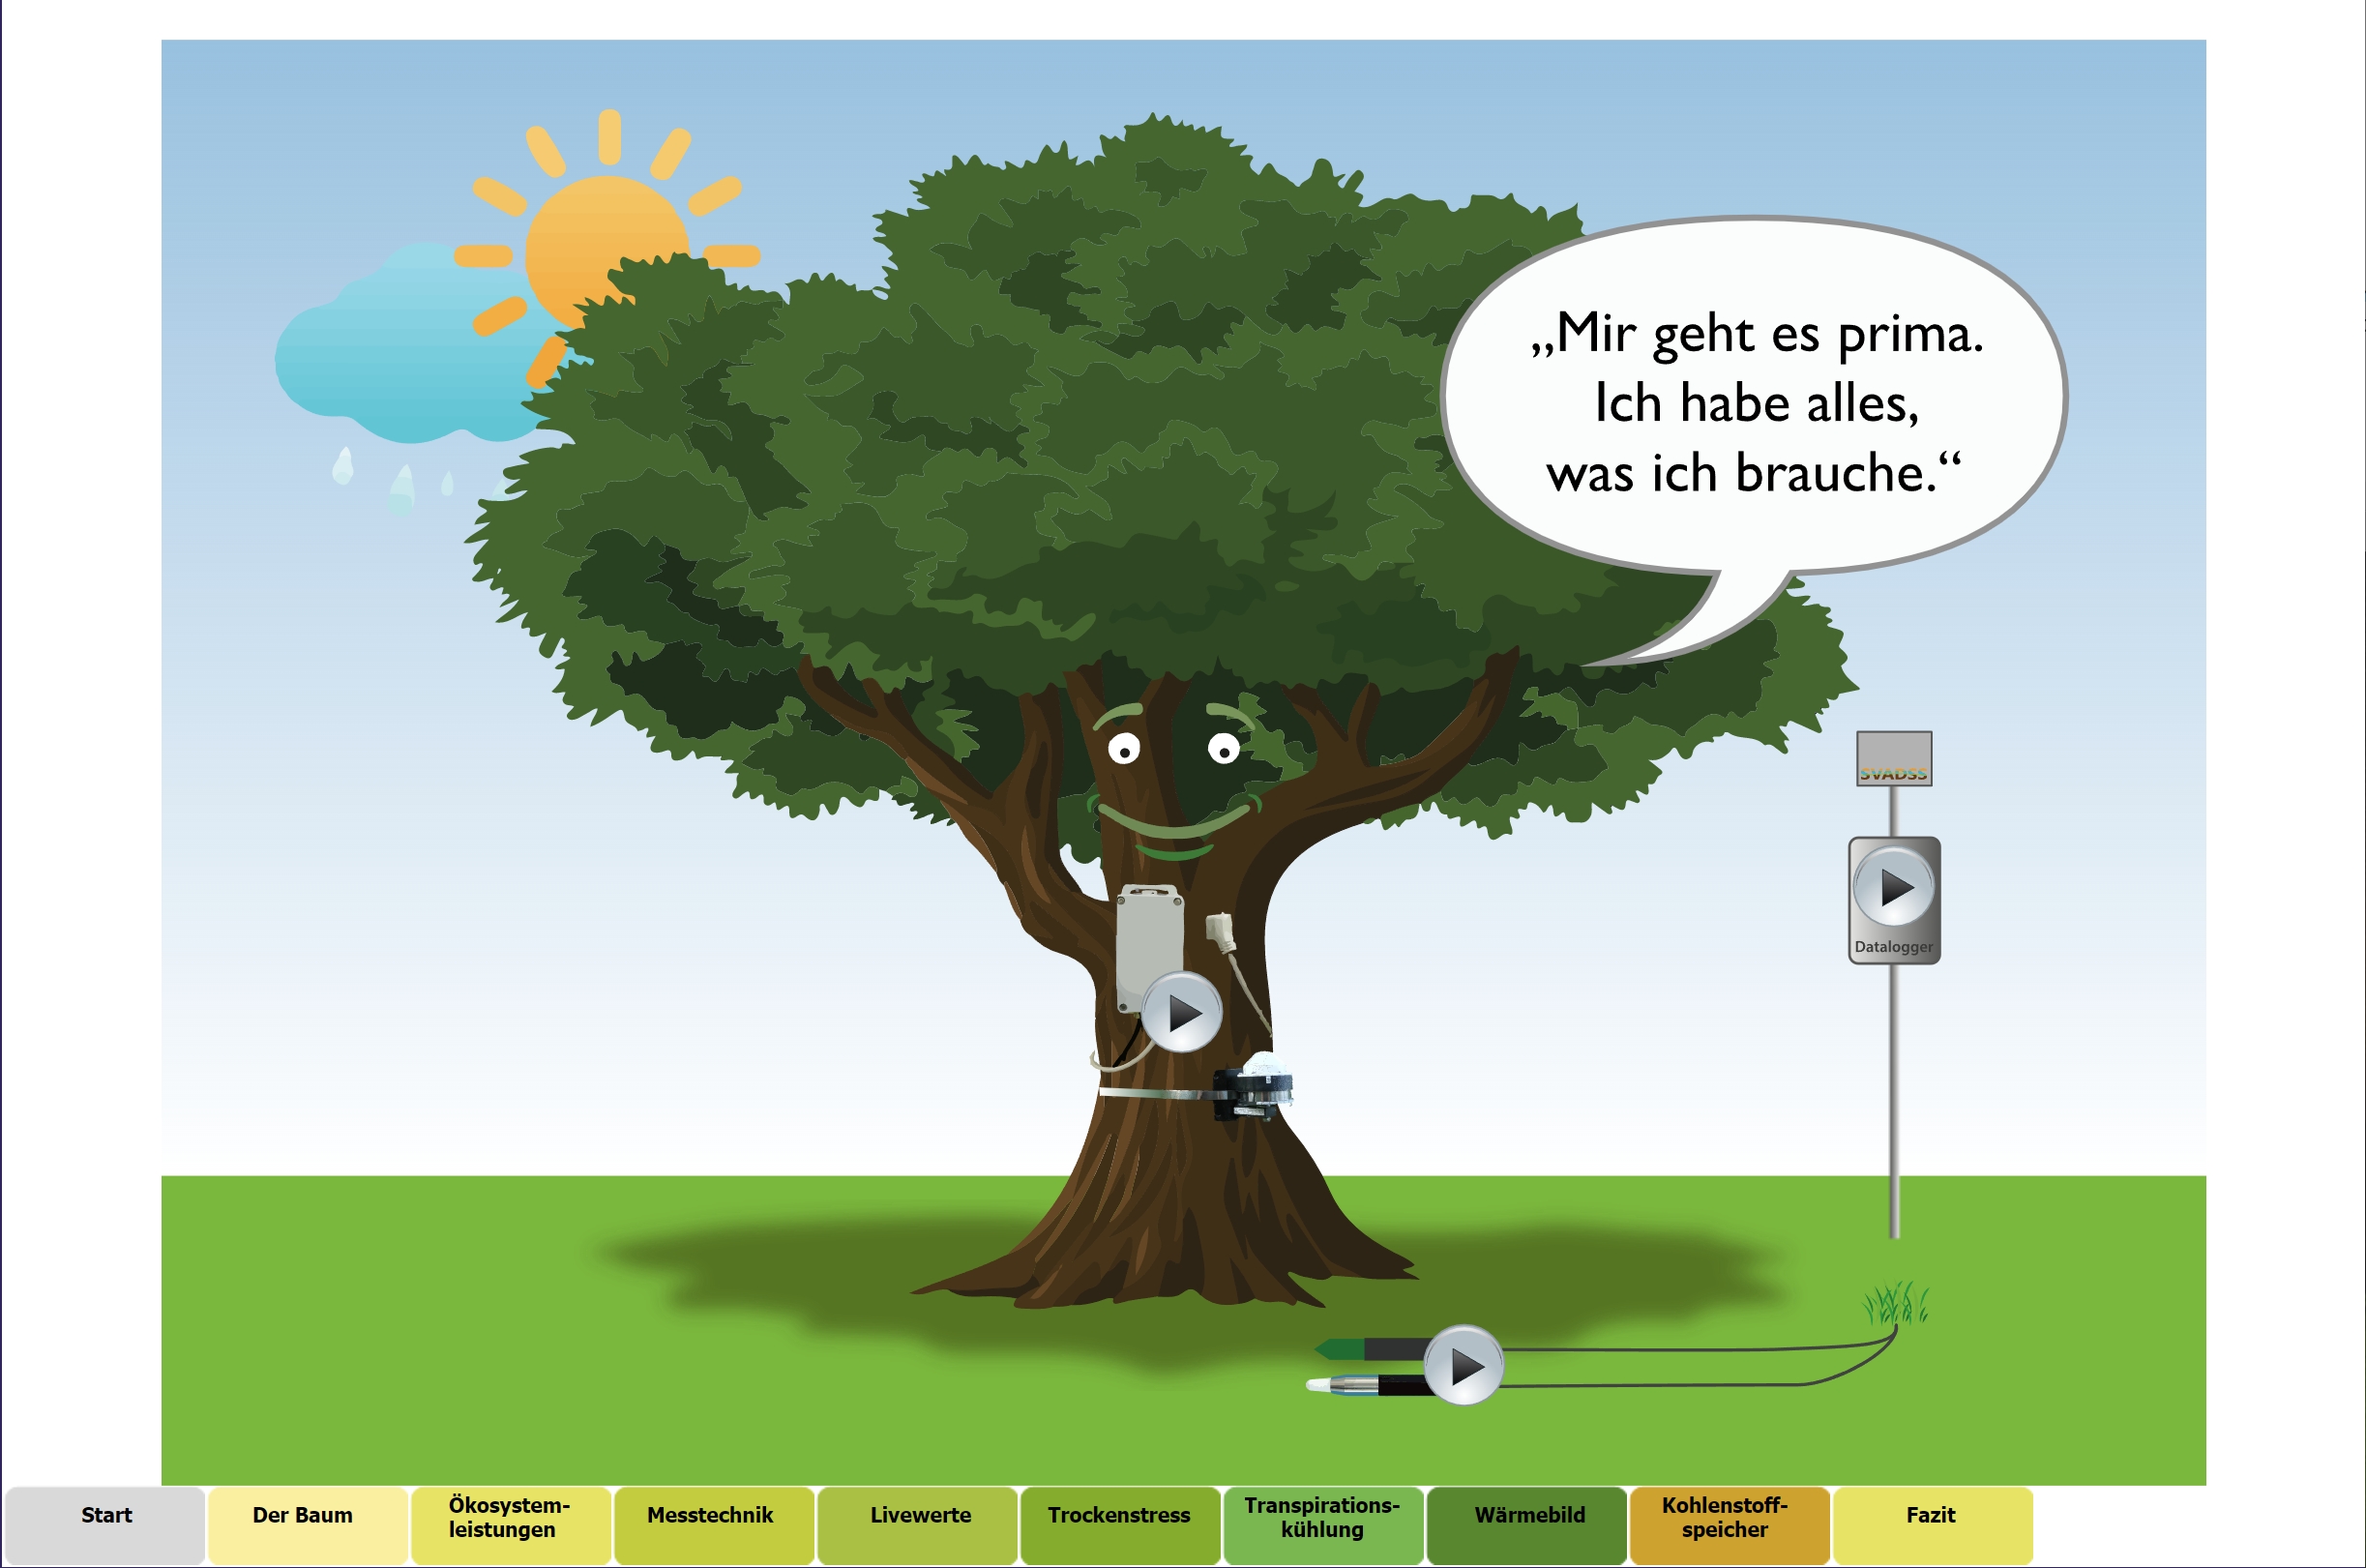
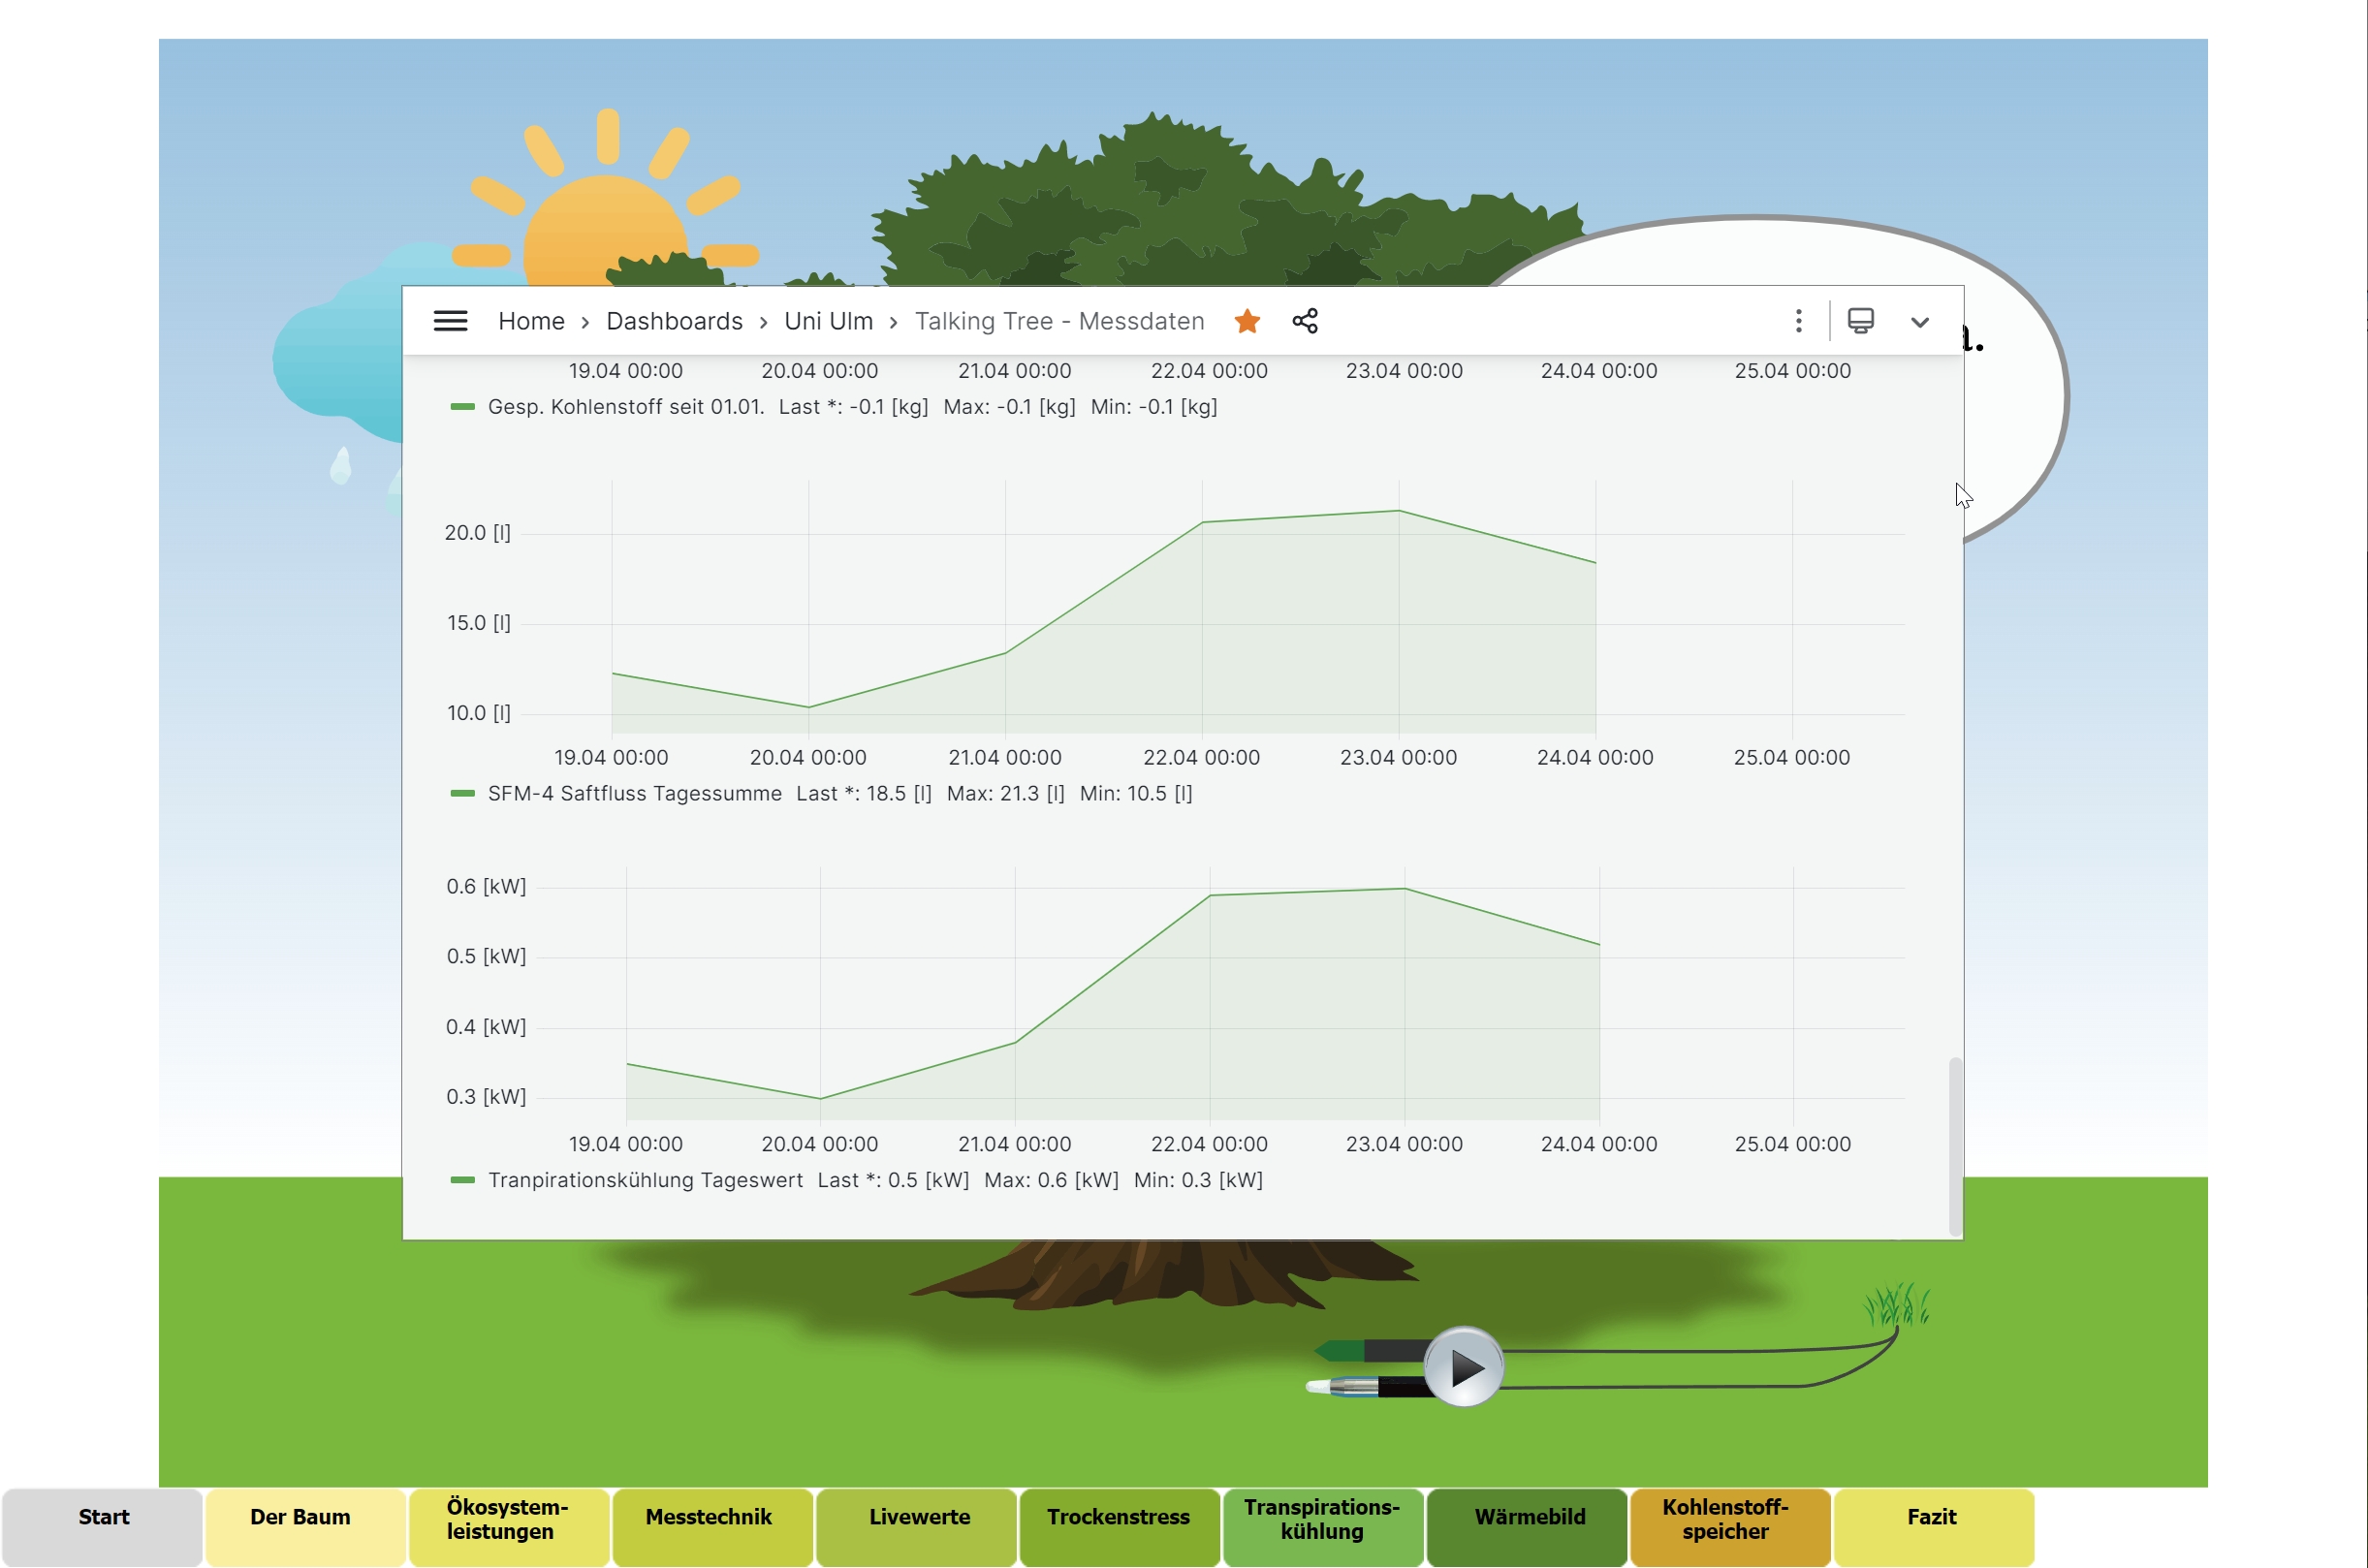
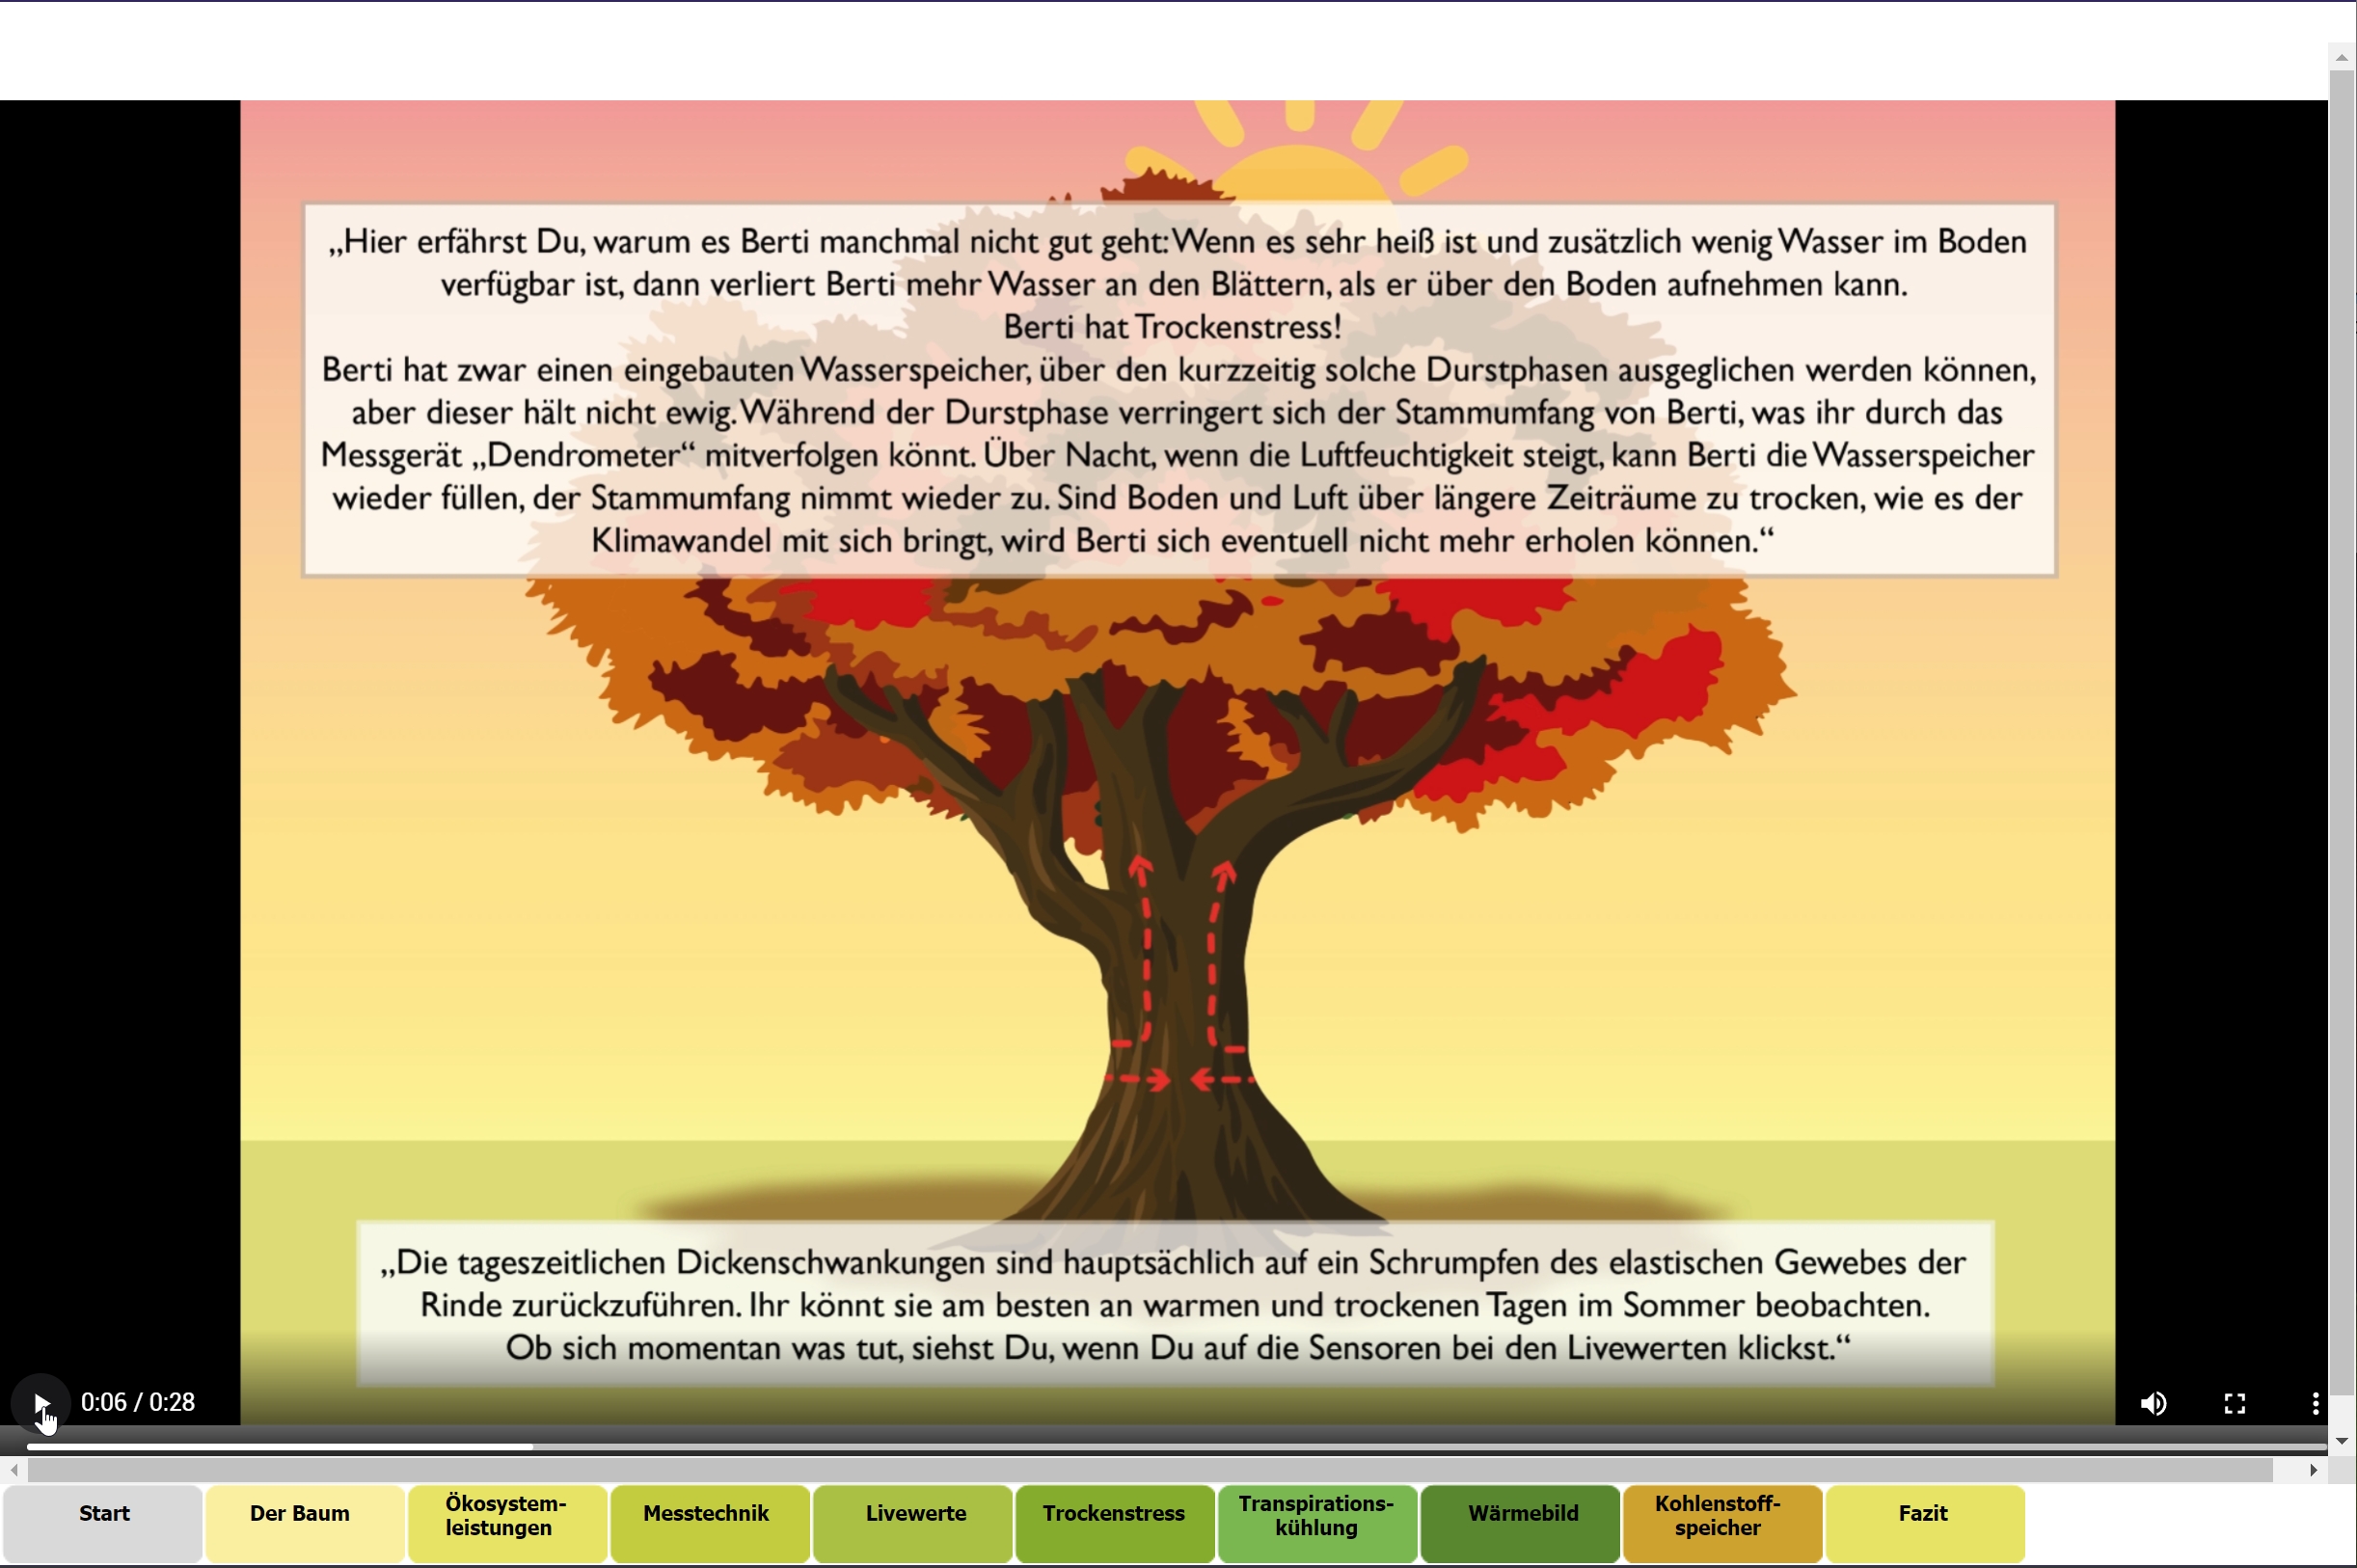
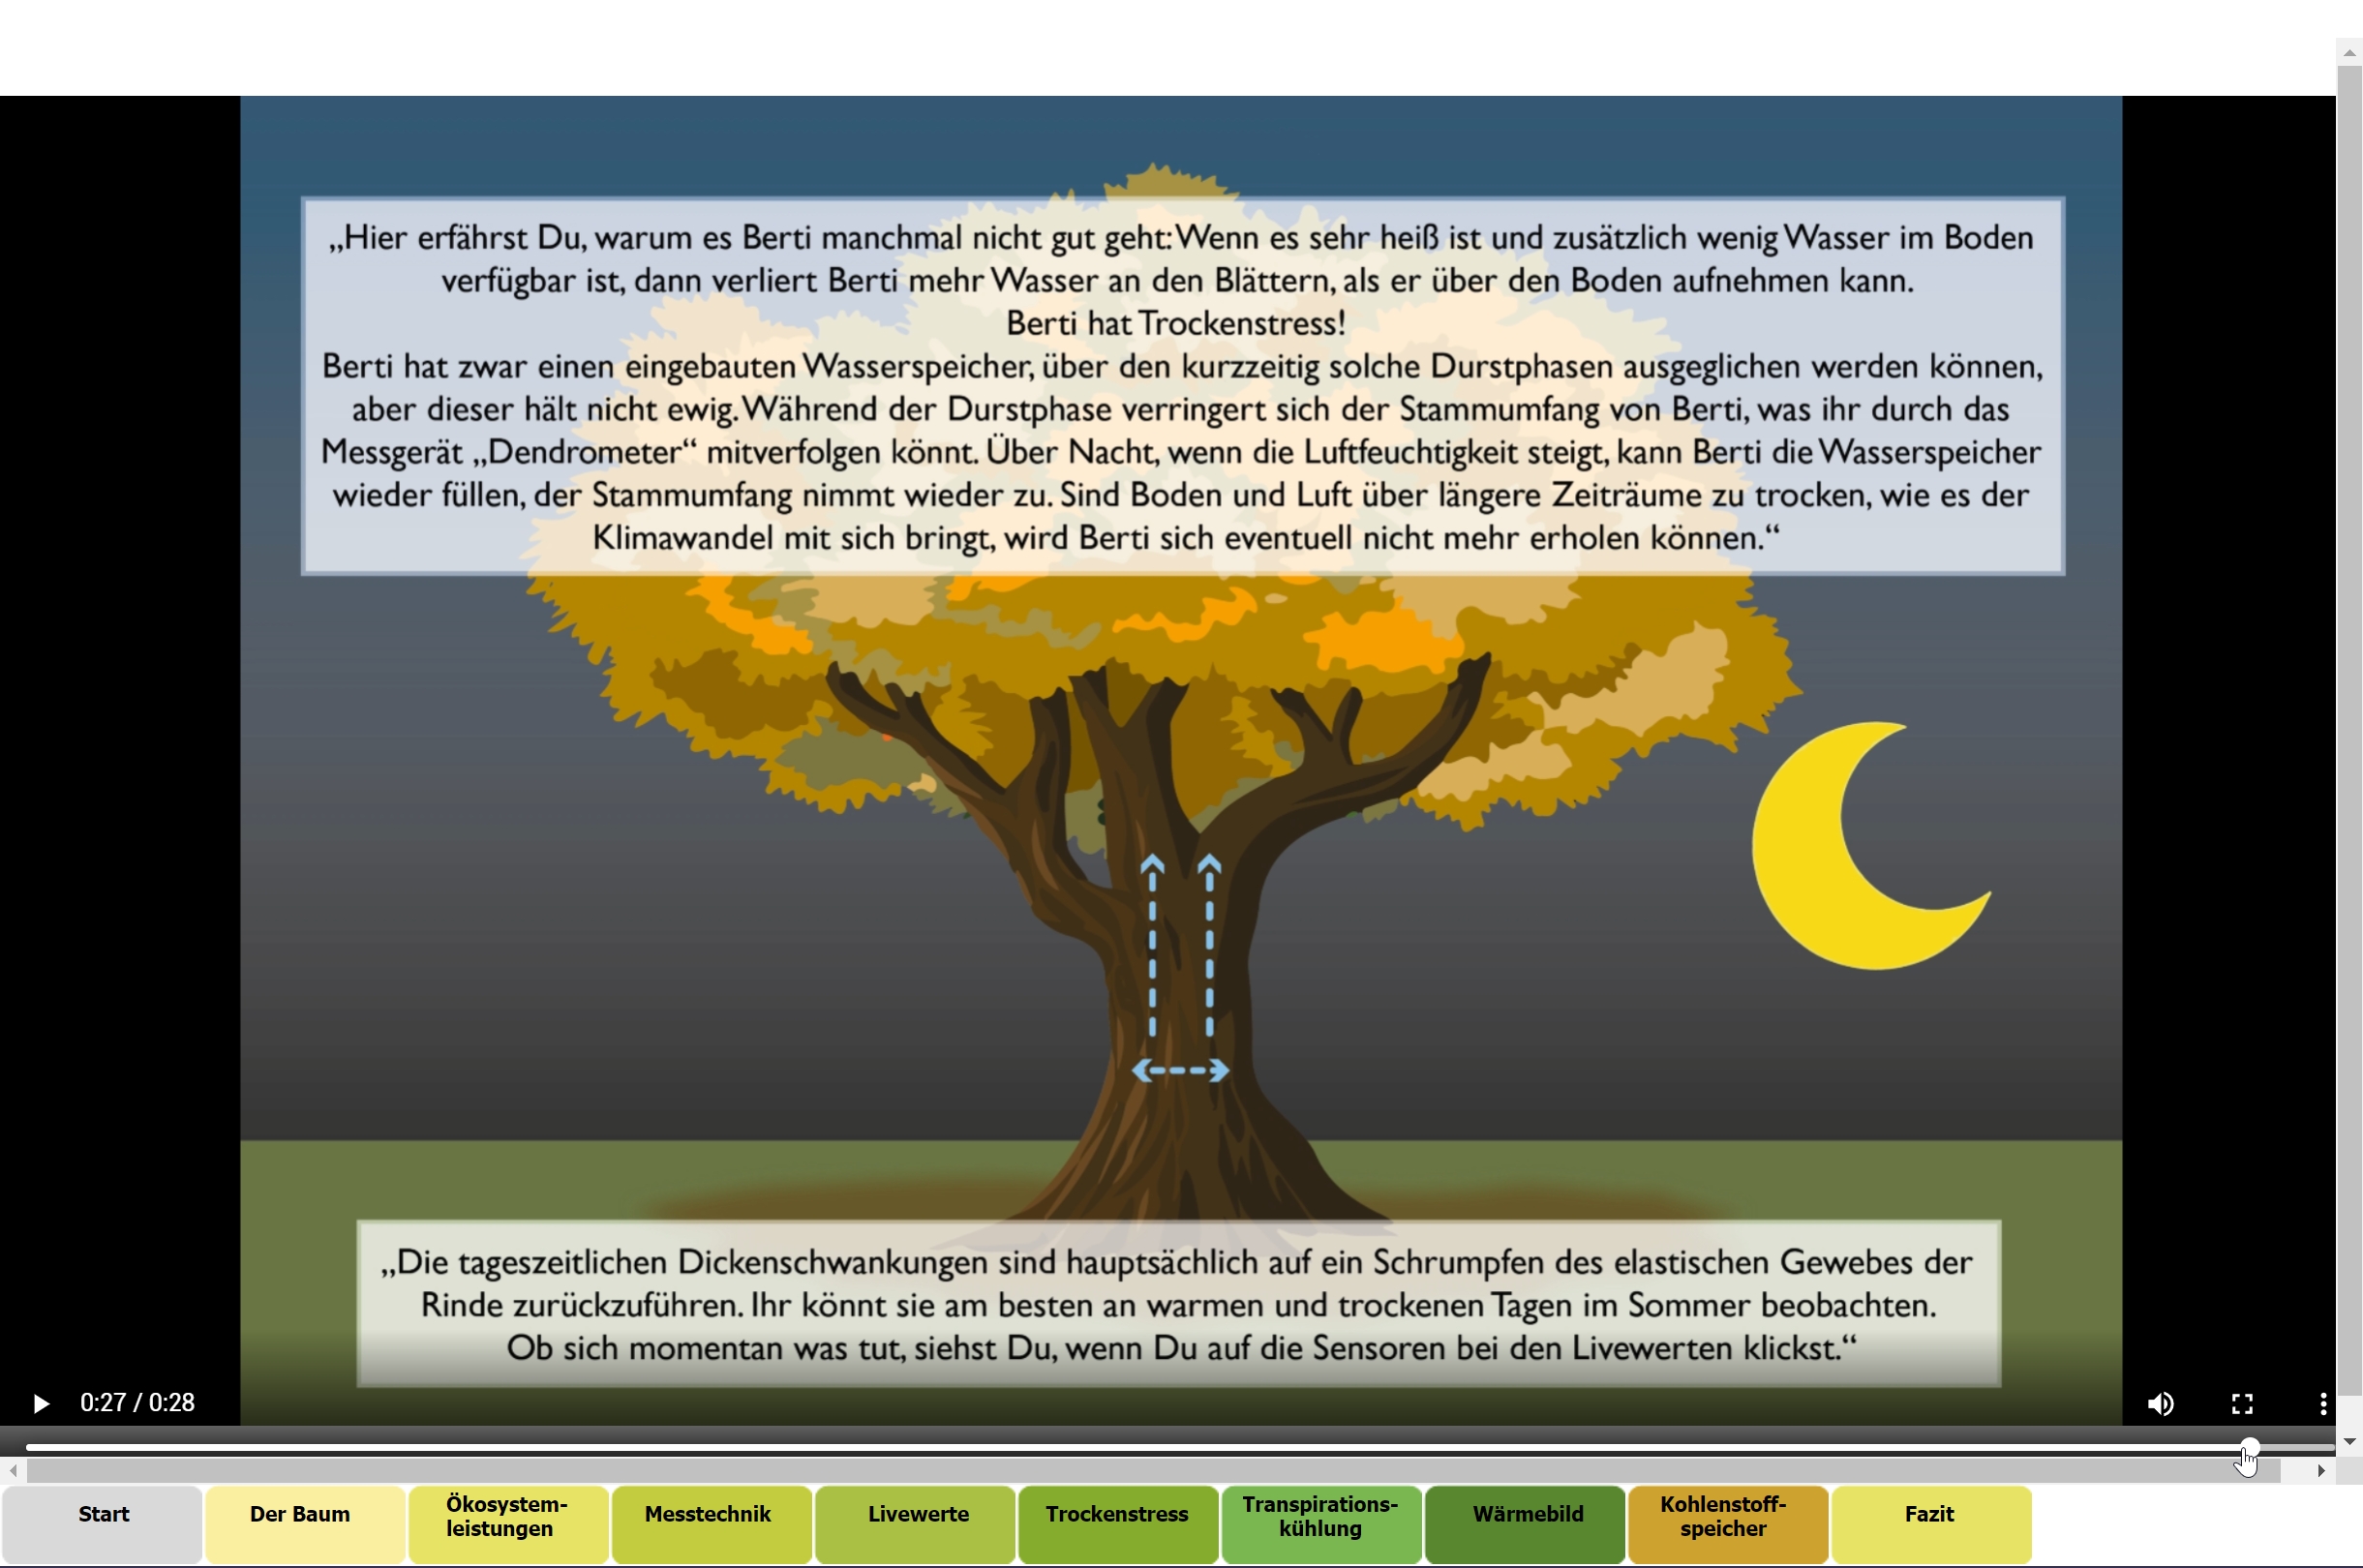
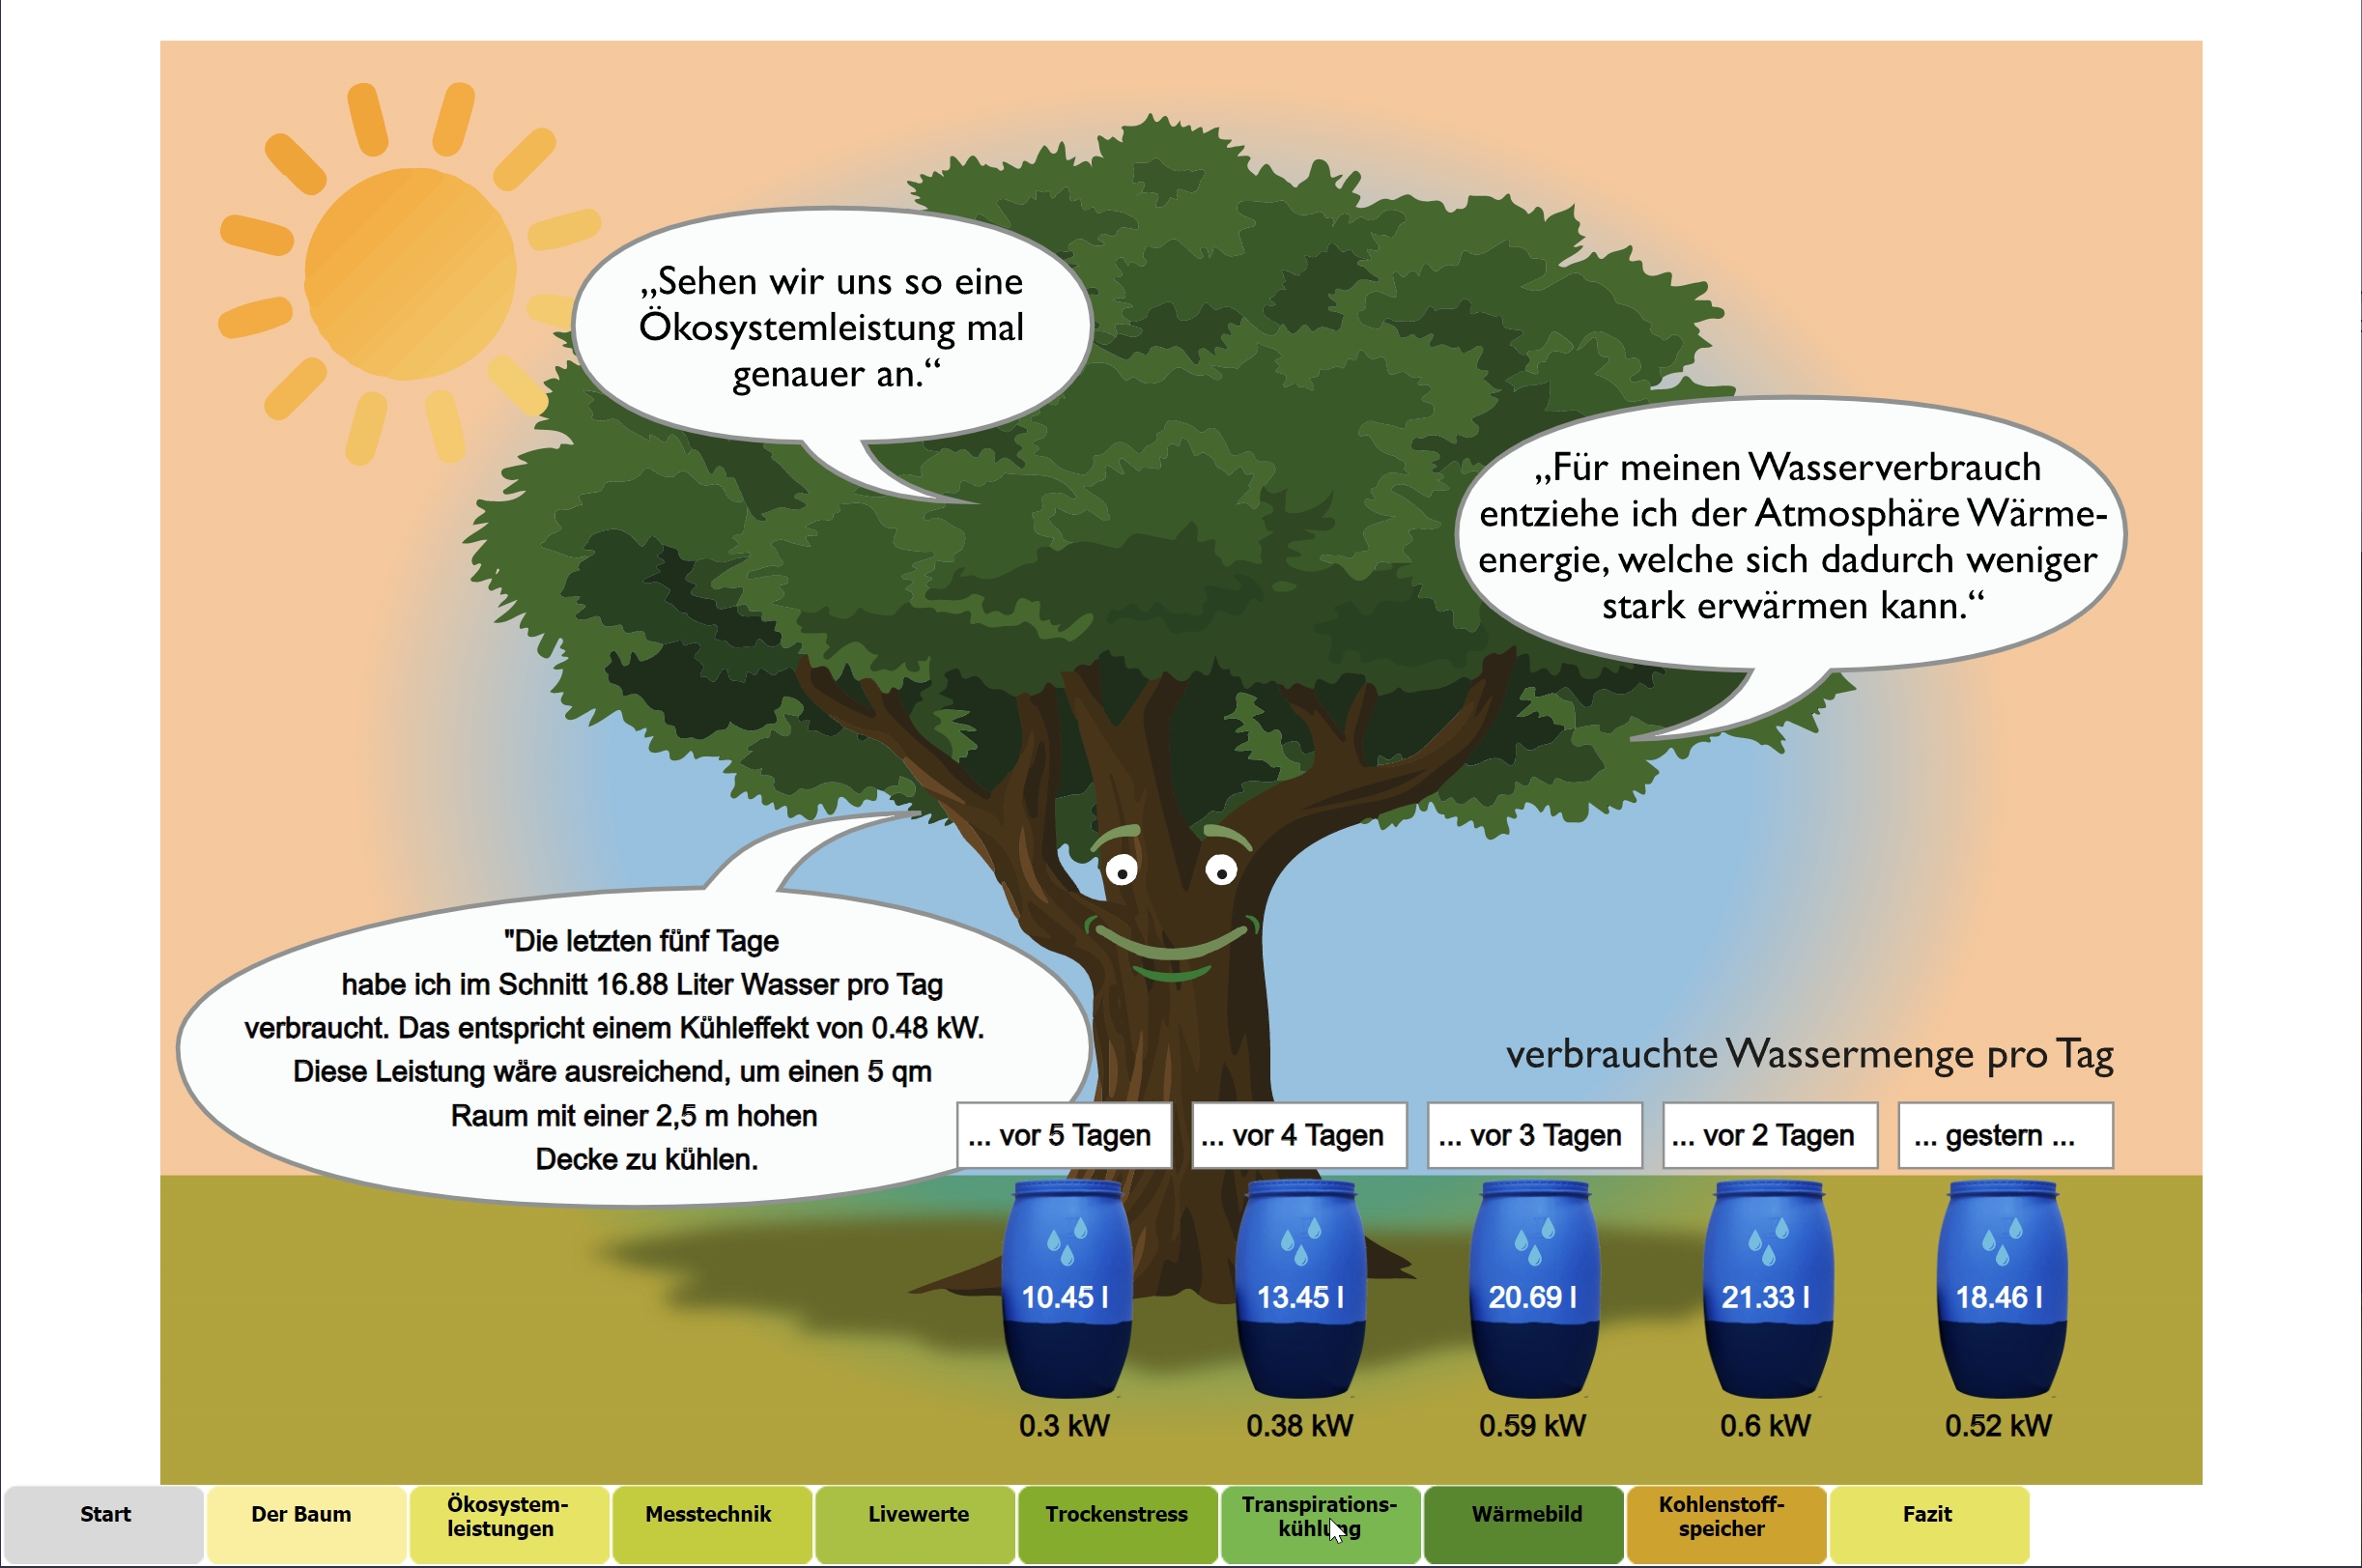
Talking Tree “Berti”
The Talking Tree “Berti” is a project in which a tree and its surroundings were equipped with tree and soil sensors. The evaluation of the measured values provides information about the current state of the tree.
Berti is not only a research project of the University of Ulm, it is also a teaching tree for young and old, for which, in addition to the normal visualizations, a web application for teaching purposes has been developed and set up by SVADSS.
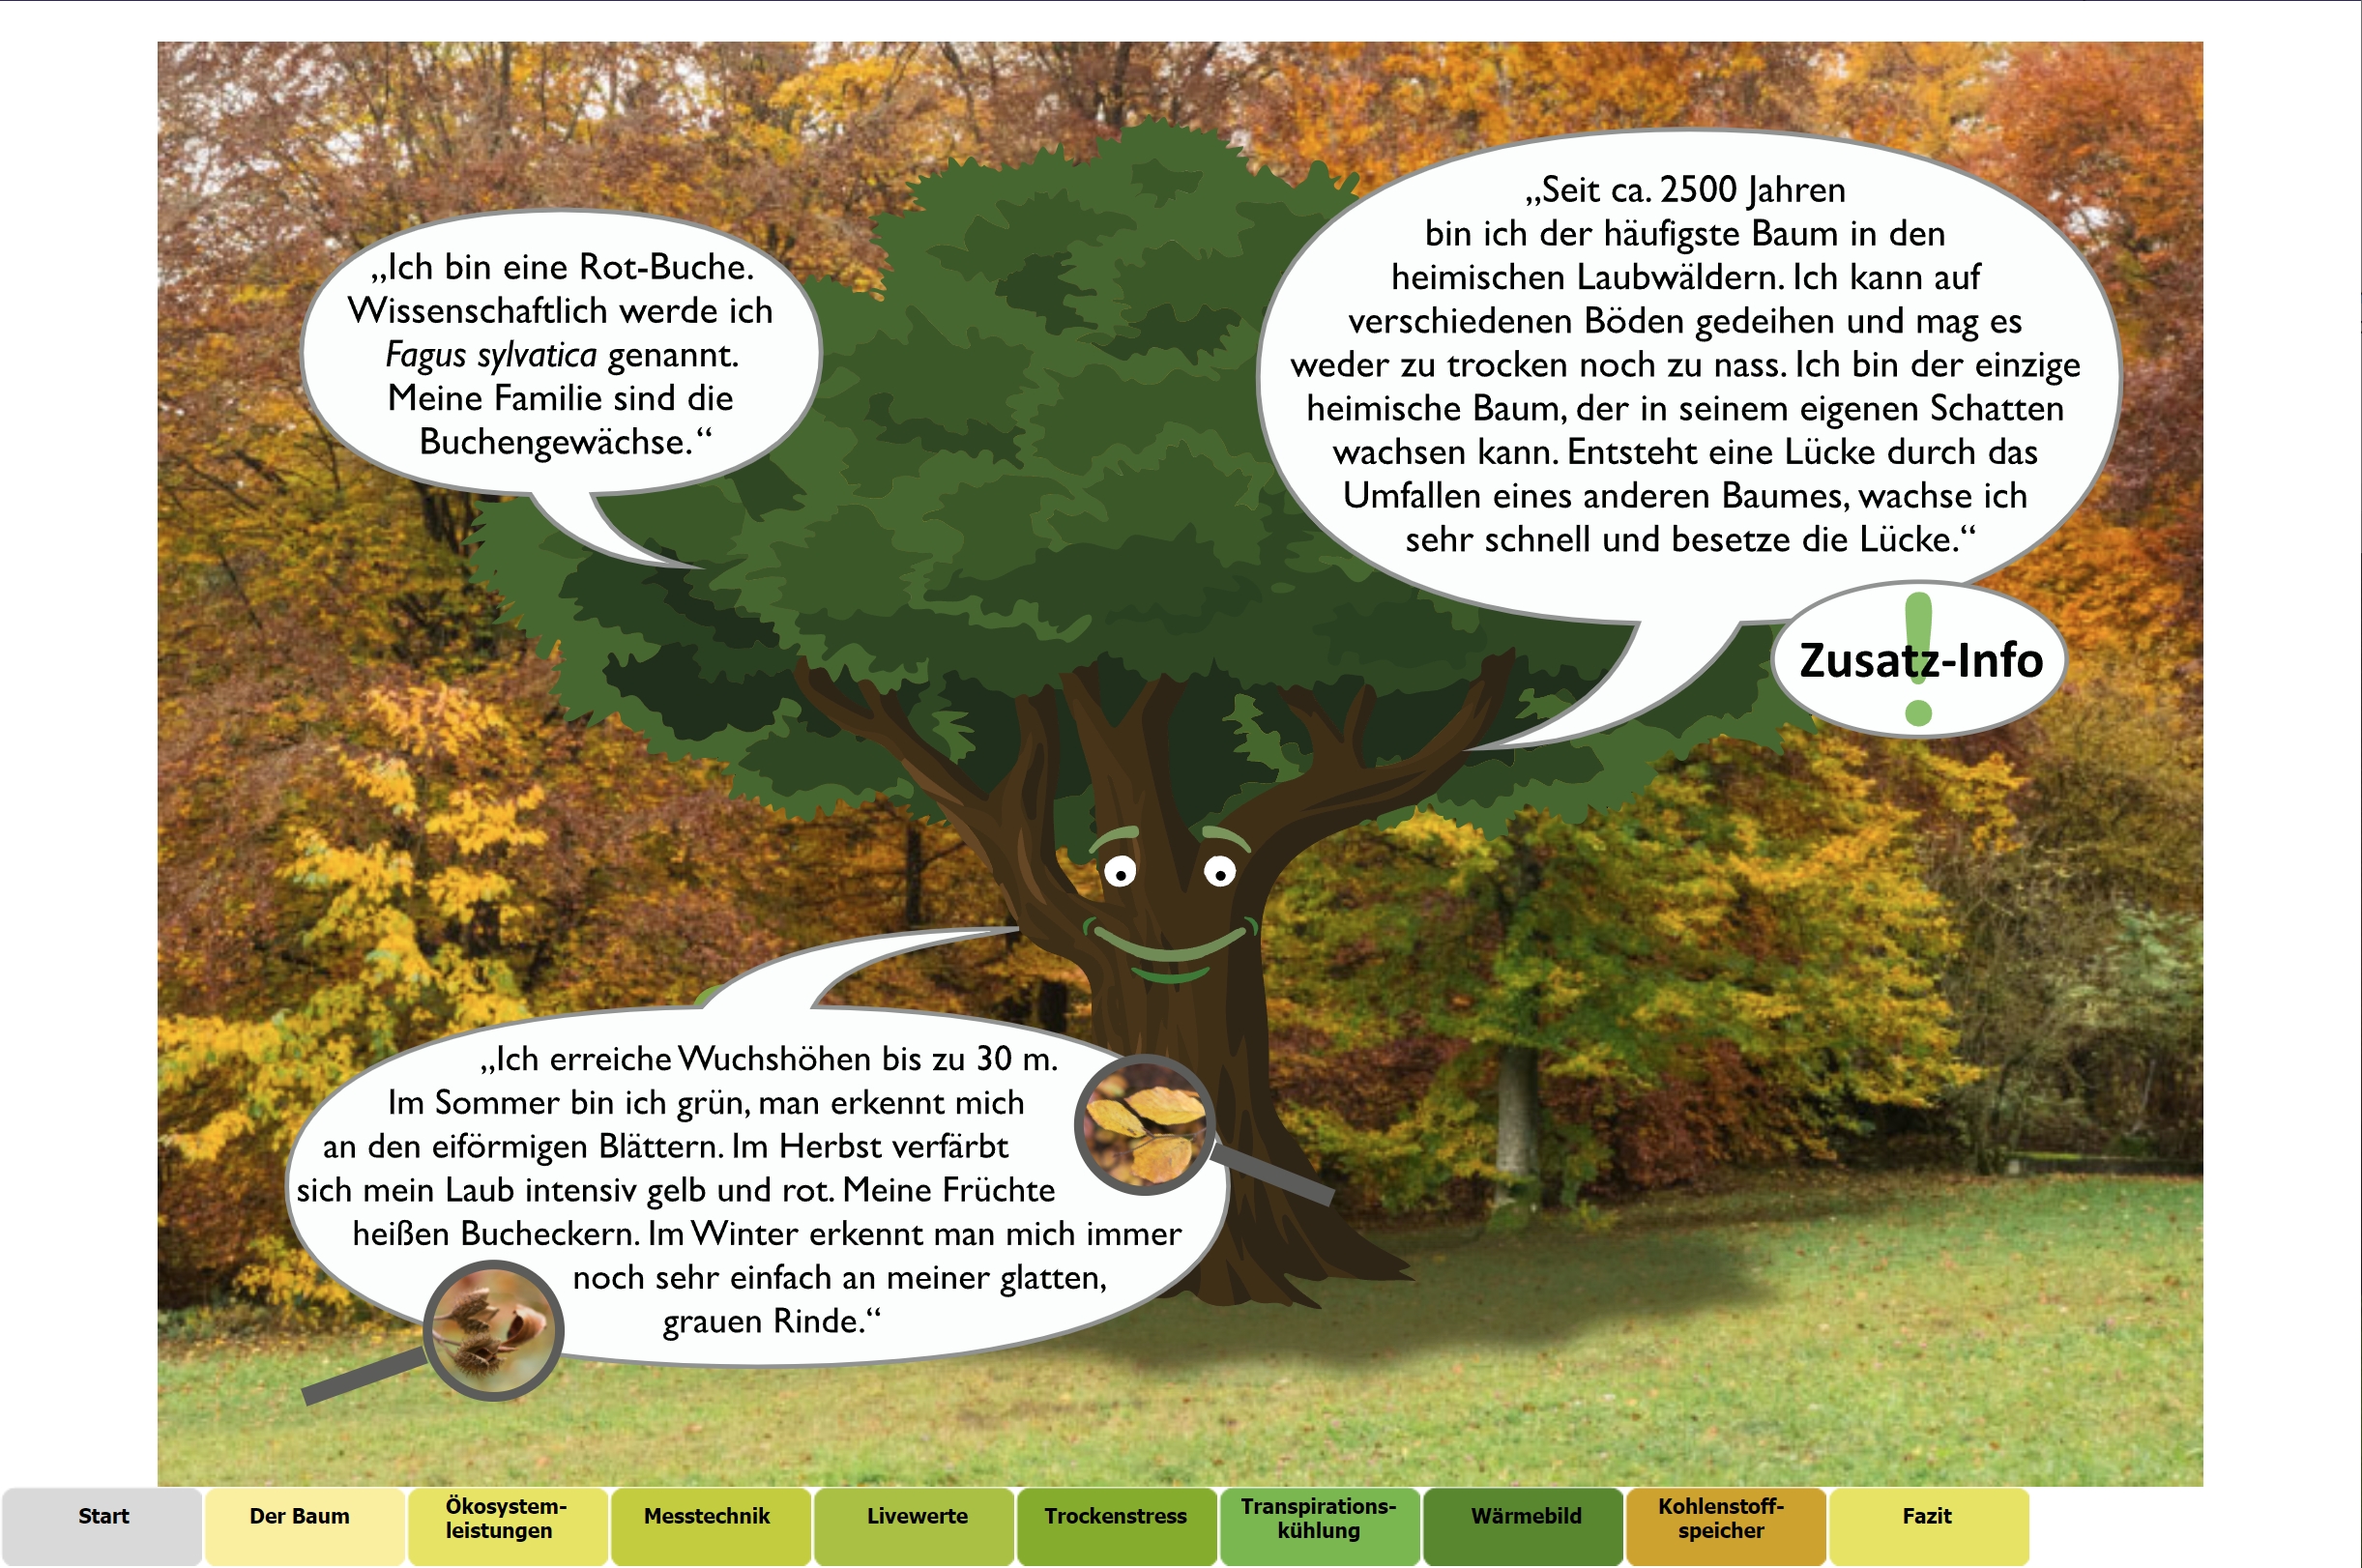
The application provides information about
- Tree species
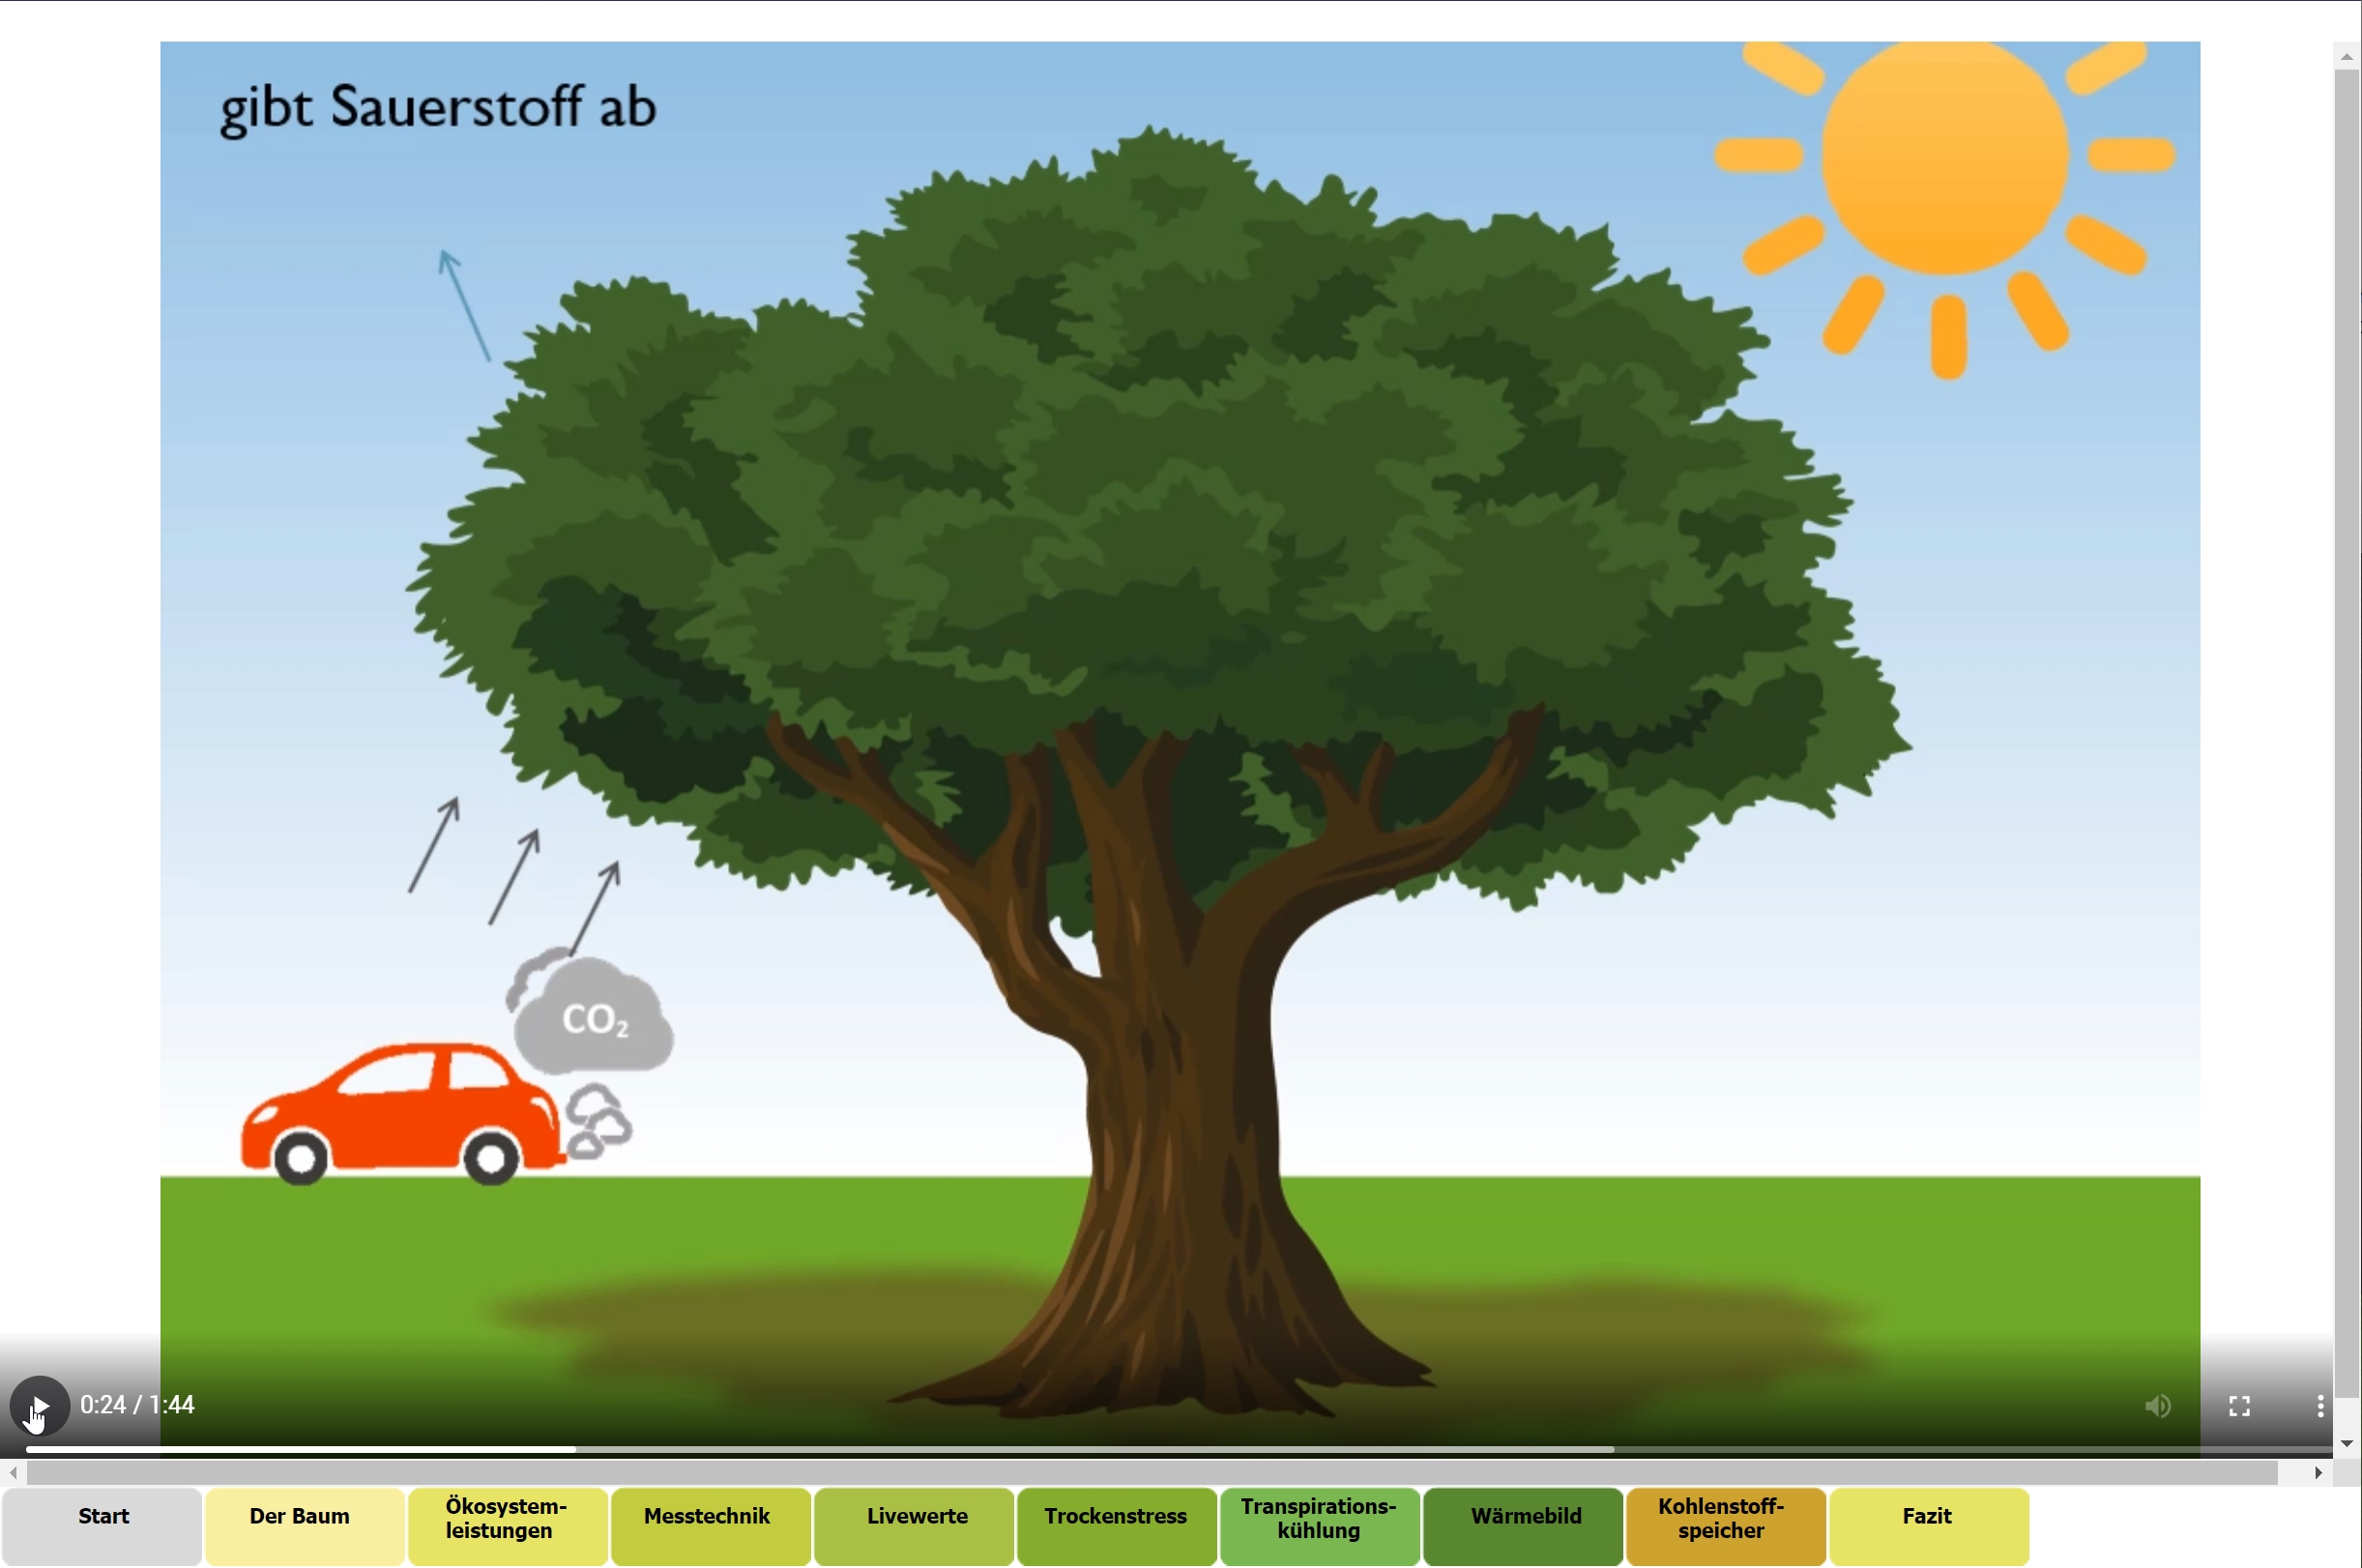
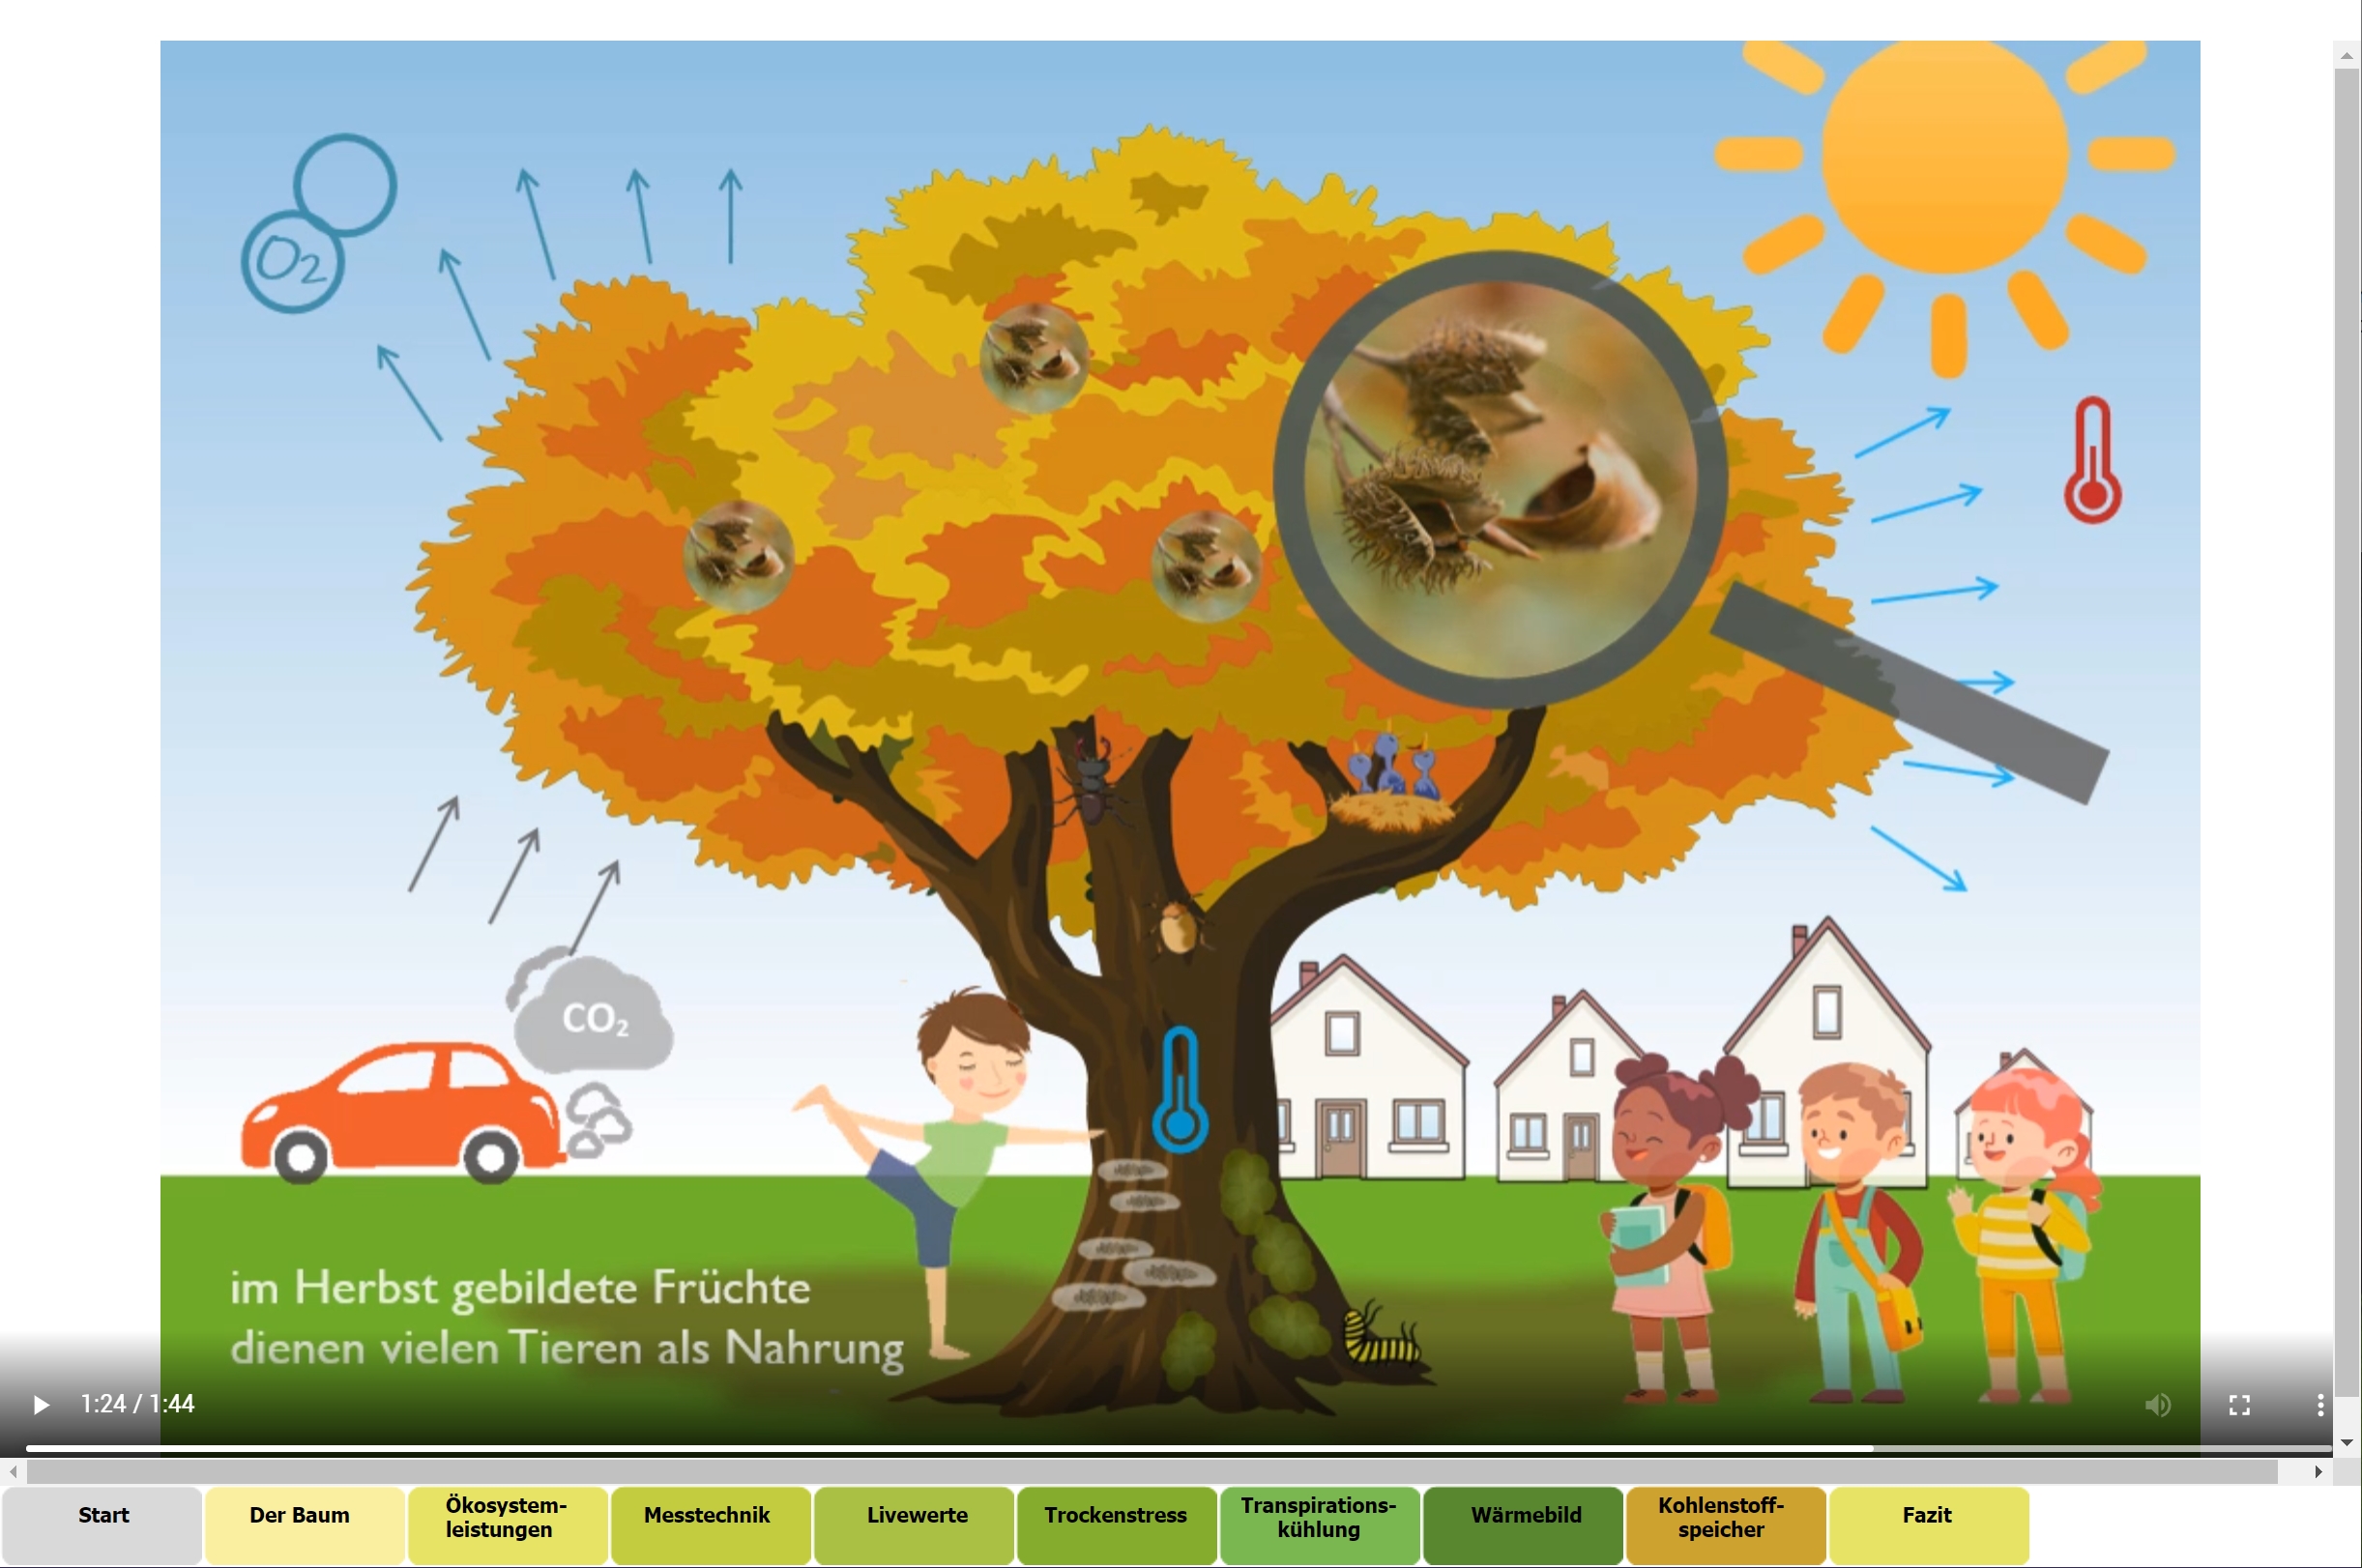
- Ecosystem services
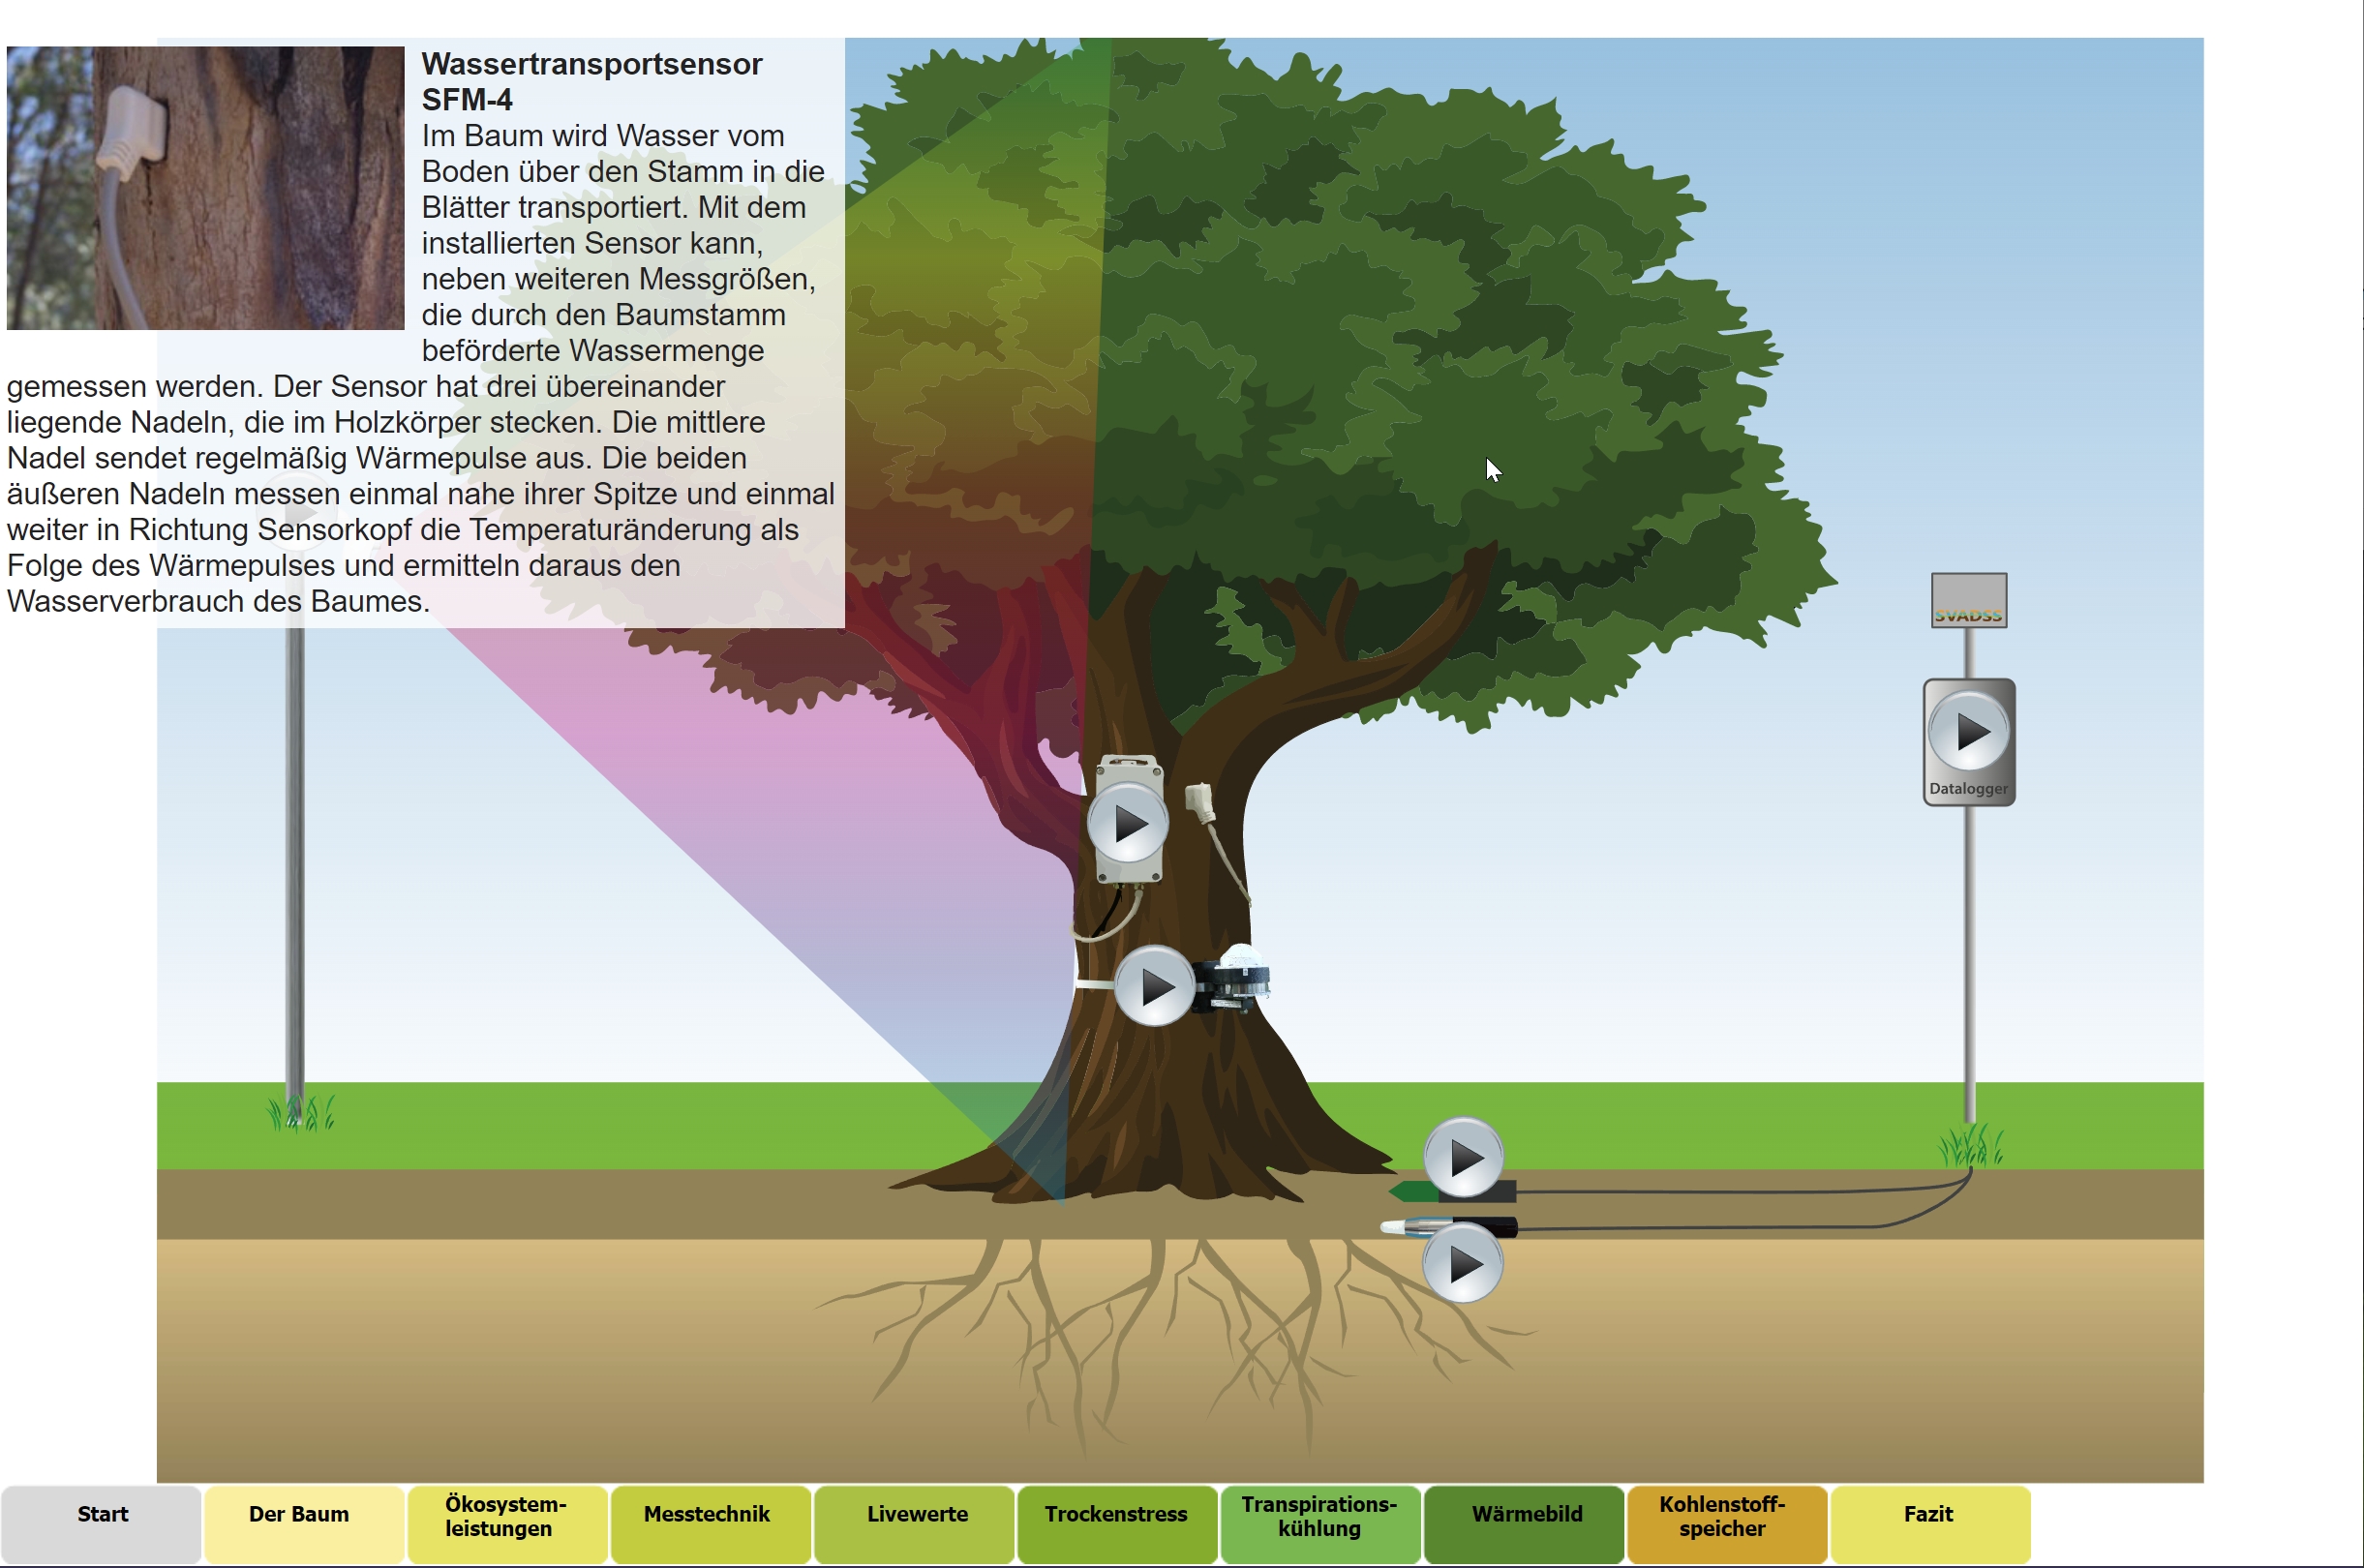
- Measurment technology
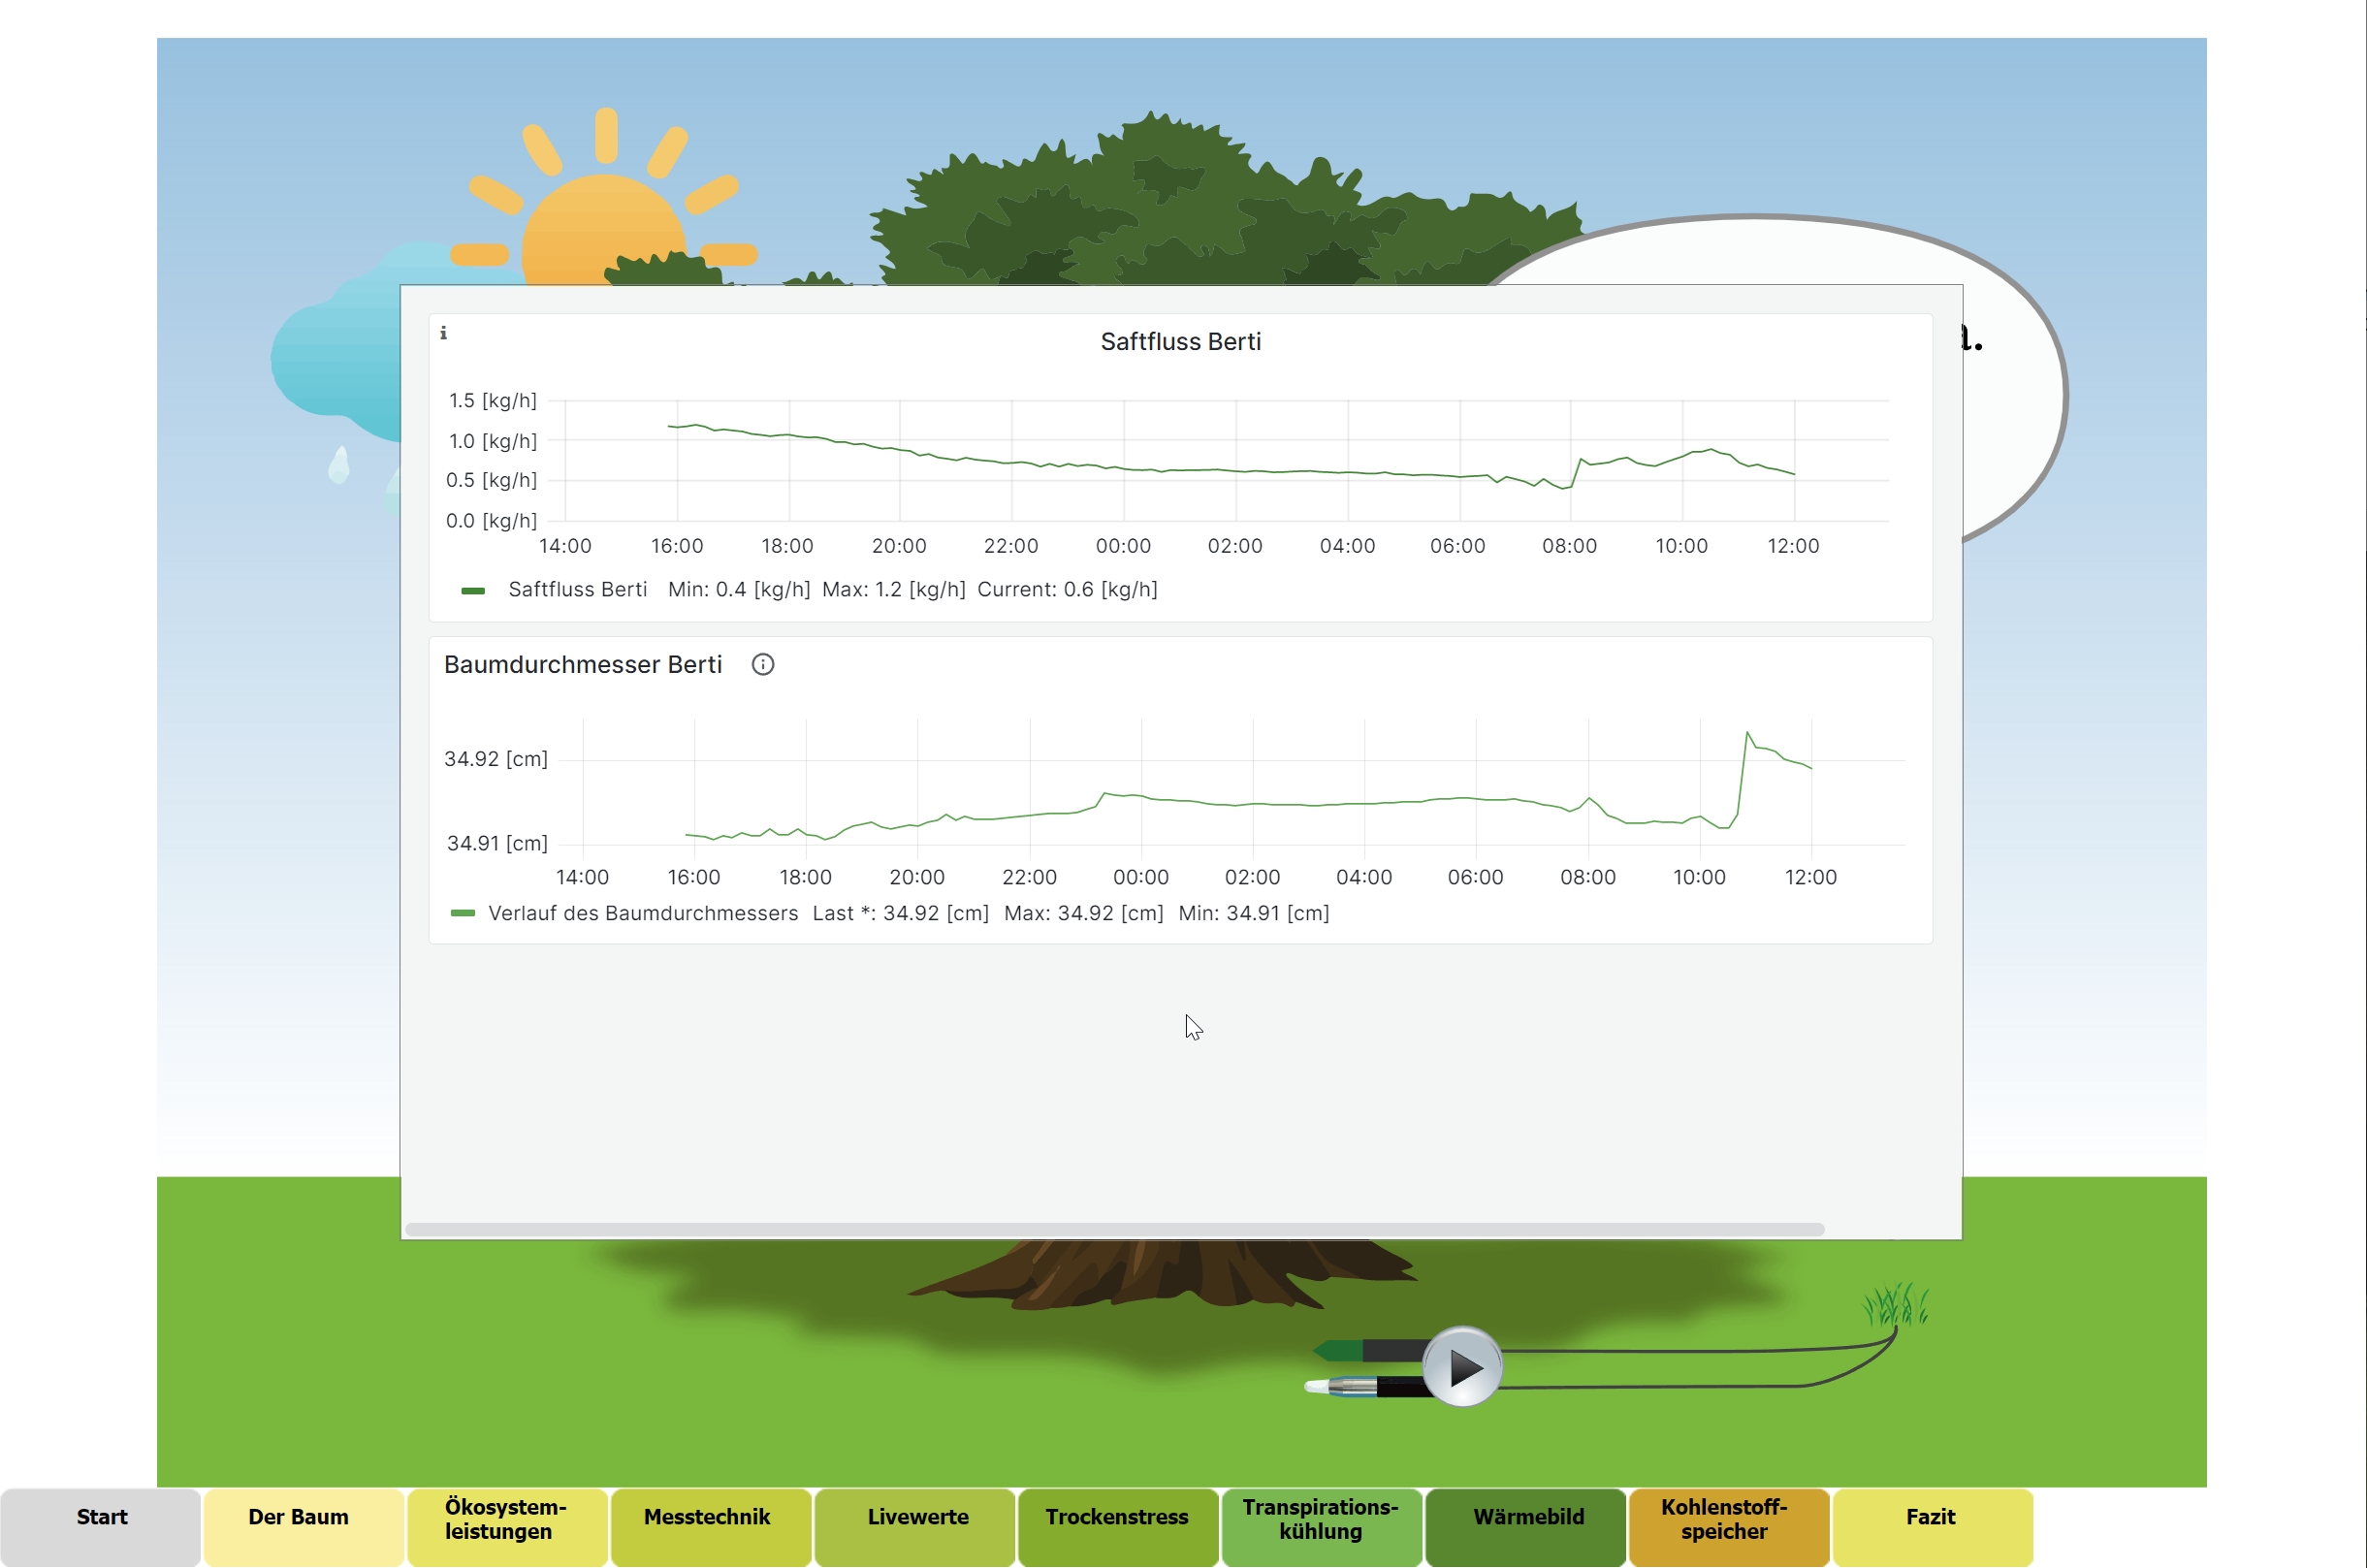
- Live measuring data
- Drought stress
- Perspiration cooling
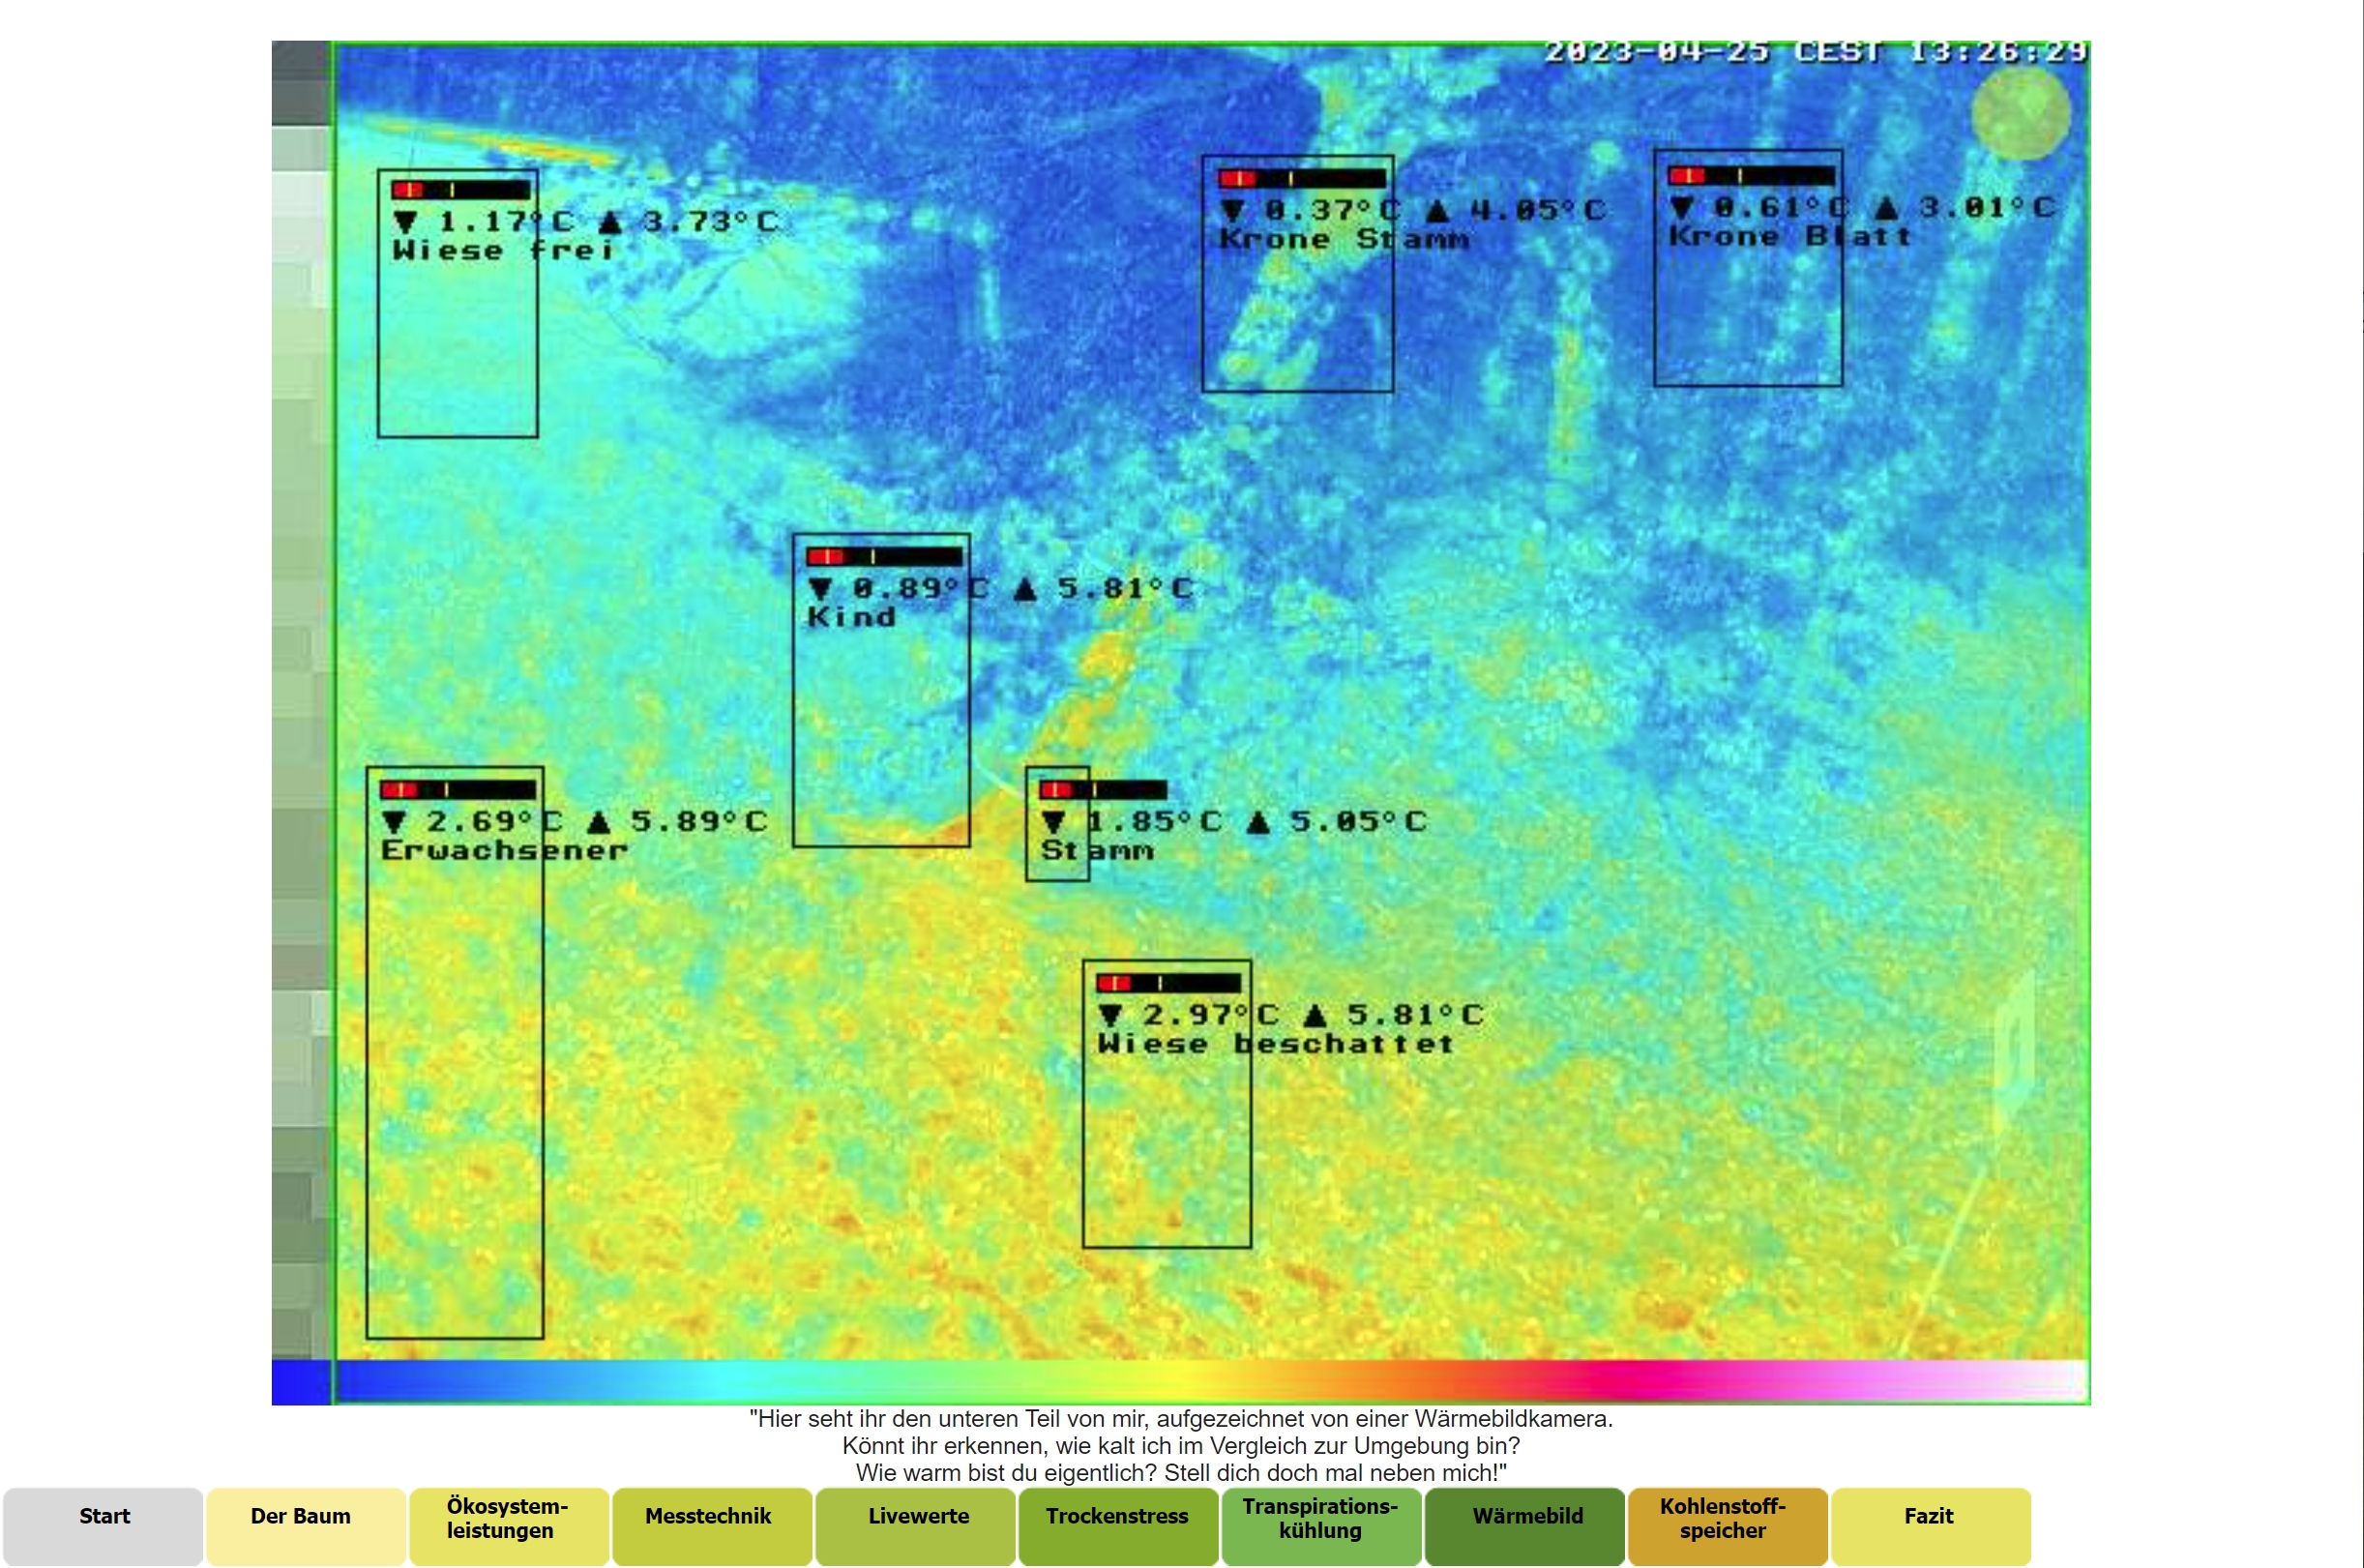
- Live thermal cam images
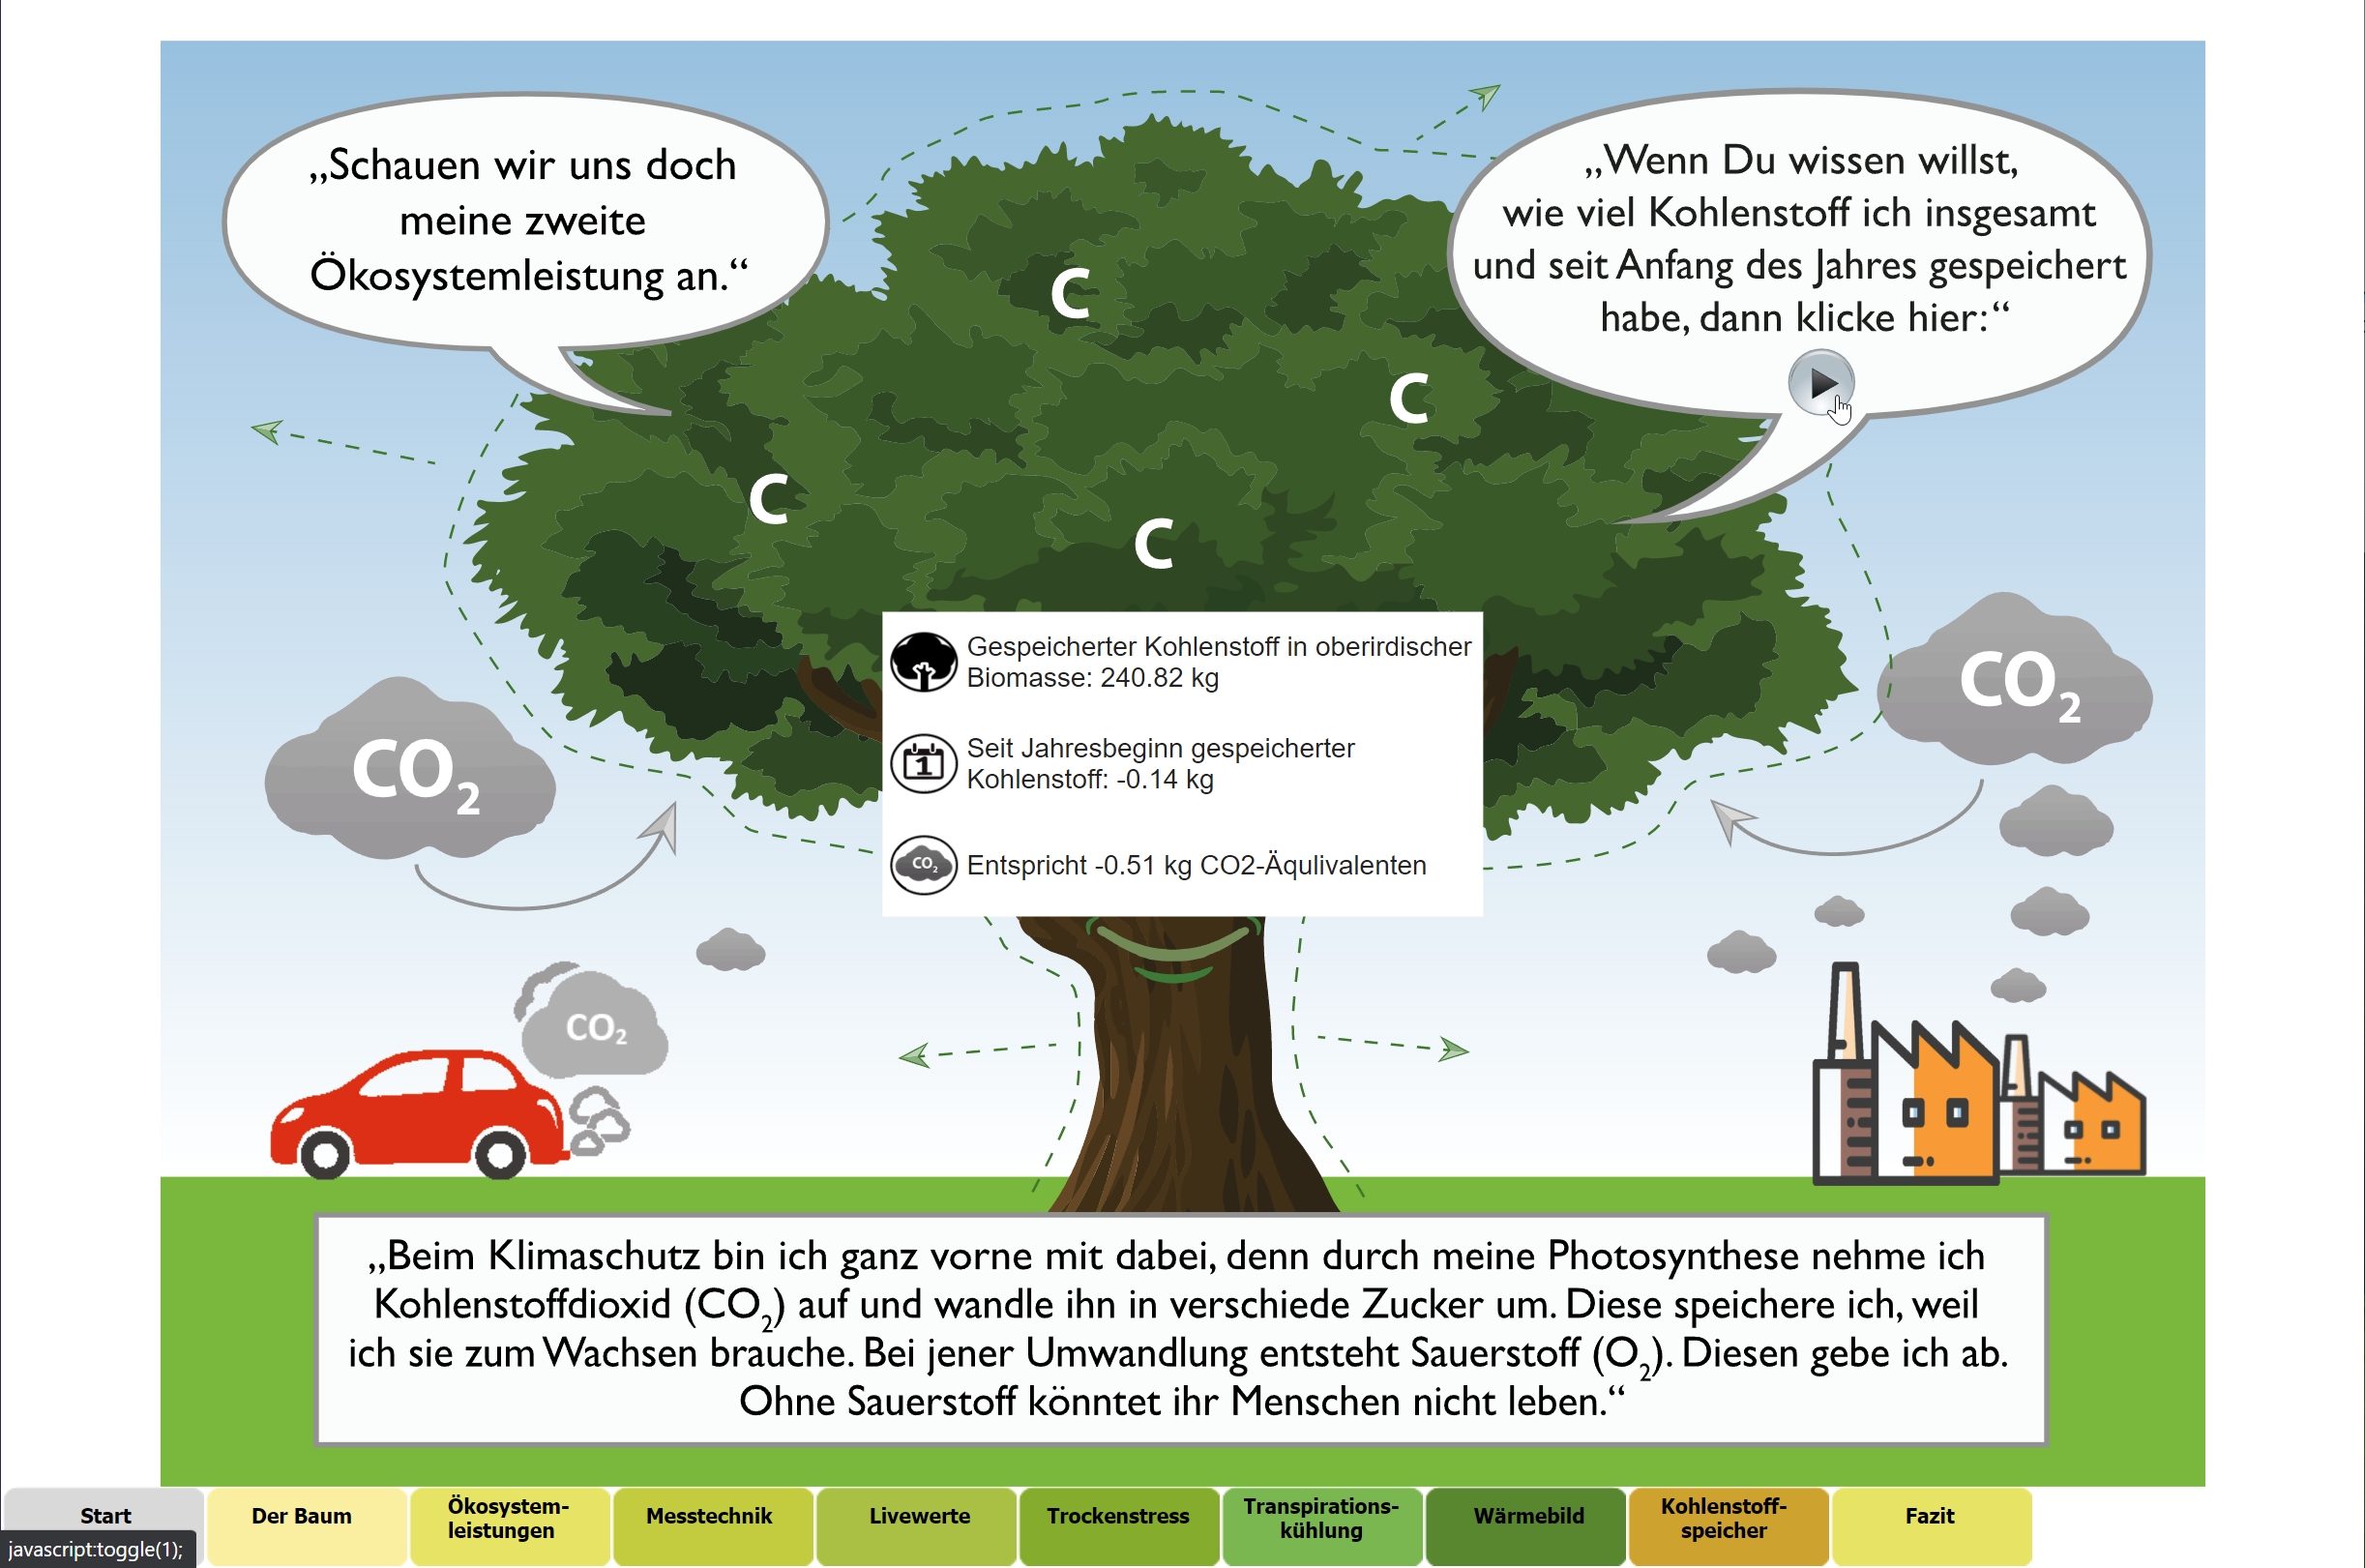
- Carbon storage of the tree
The Talking Tree “Berti” can be visited in the botanical garden in Ulm and its condition can be observed live on site in the web application.
It is therefore unique in its kind as a research and teaching tree in the forest of talking trees.
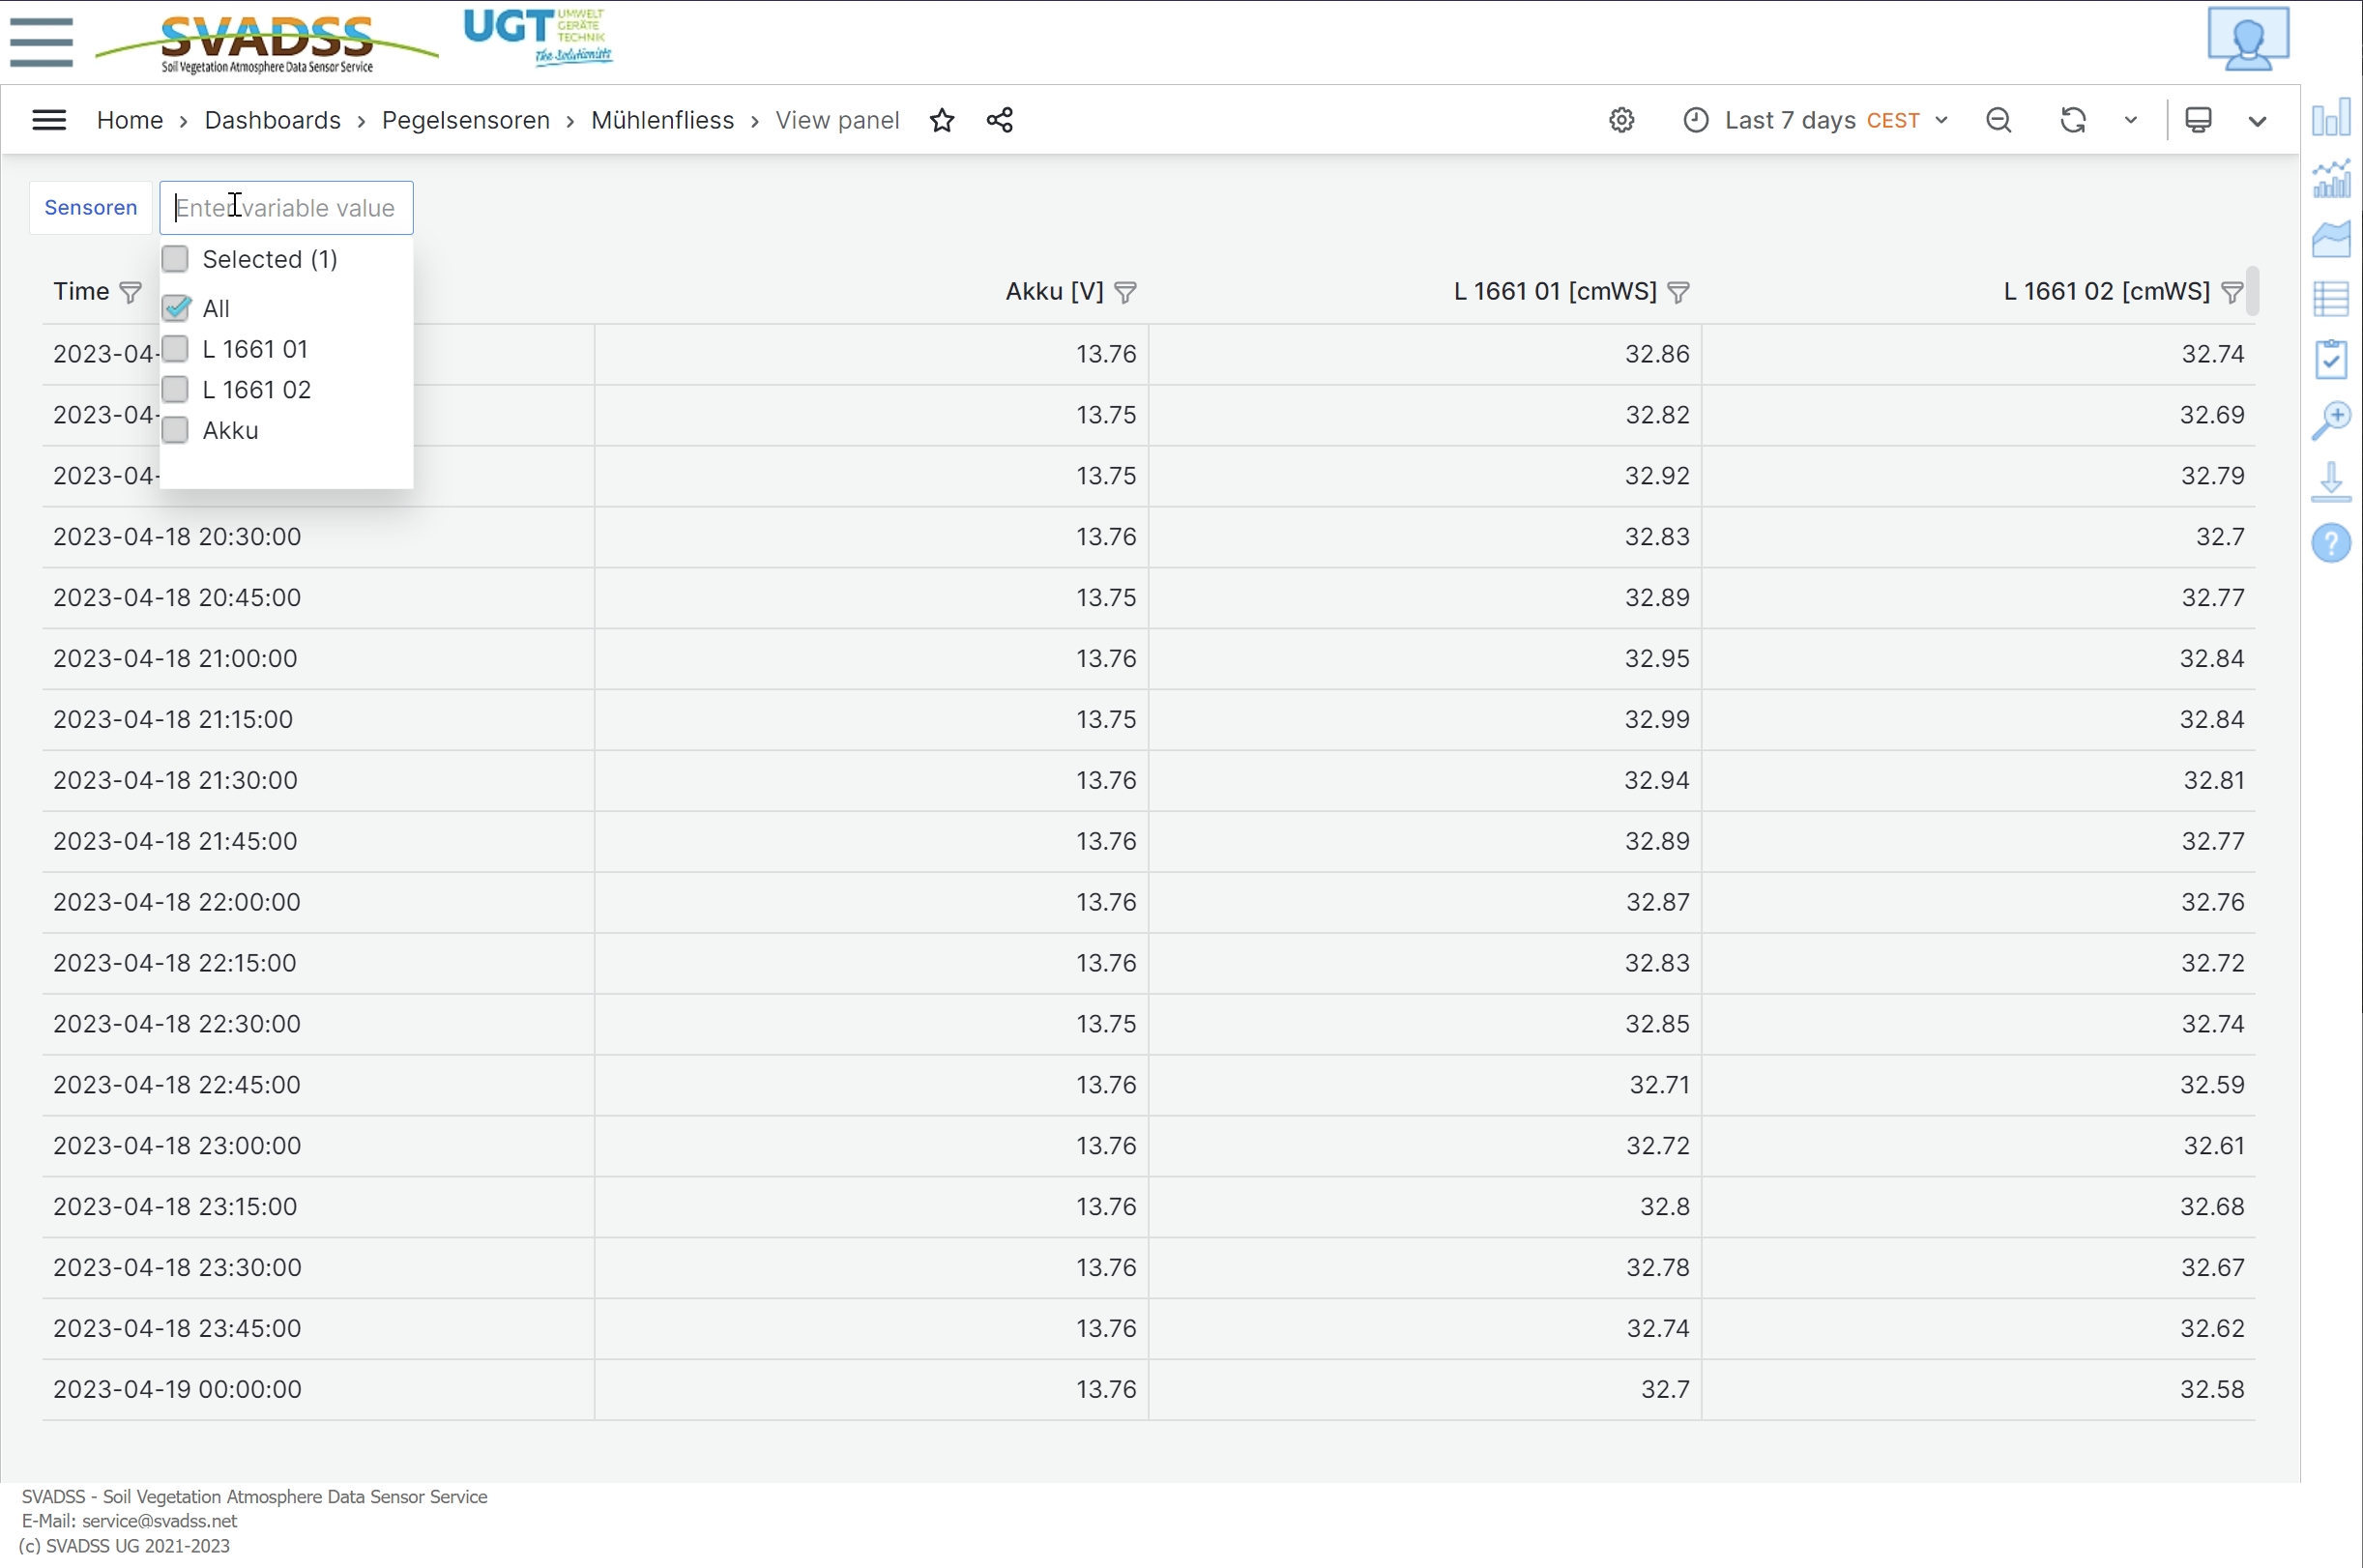
Pegel-/Wasserstands-Monitoring
The application example shows the level monitoring of a water depth gauge.
The measurement data is updated every 15 minutes.
Individual event and alarm states were defined by the customer, which are transmitted directly to the customer when they occur.